La Niña singled out Canada for its coldest shot in April

Canada was one of the (relatively) coldest places on Earth last month.
The latest climate assessments from NASA, NOAA, and other global climate agencies show that while much of the world continued to experience warming, North America experienced its coldest April in years, and Canada got the brunt of that chilly weather.
According to NOAA, April 2022 was the fifth warmest month of April recorded in the past 143 years. Based on their own data, NASA ranked it as the 7th warmest April. Meanwhile, global temperature tallies from the Japanese Meteorological Agency and Europe's Copernicus Climate Change Service landed in between NOAA and NASA, ranking it as the 6th warmest April on record.

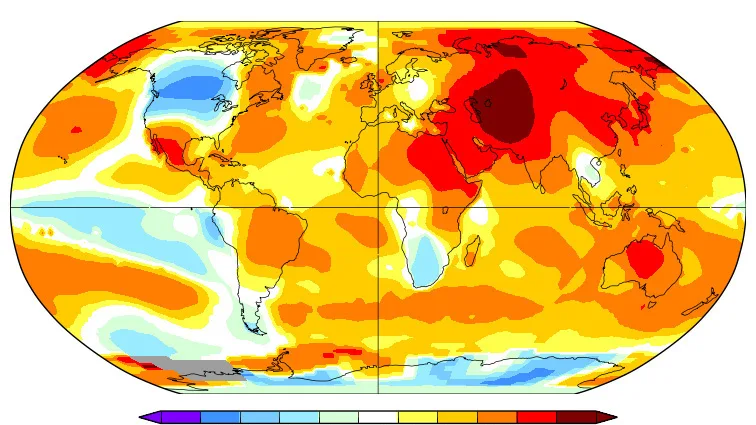
This map of April global temperature anomalies shows the relative cold and hot spots around the world, compared to the 20th century average. While an extreme warm spot persisted over central Asia during the month, a cold blob had settled in over western Canada. (NASA GISS)
The first four months of this year have been on the cool side, which is currently putting 2022 on track to likely be the 6th warmest year on record, according to NOAA.
To find the main 'culprit' for April's slightly cooler global temperatures, and for the chilly conditions across western Canada for the month, we can likely point the finger at La Niña. Currently dominating over the equatorial and southern Pacific Ocean, the immense blob of cool sea surface temperatures from this La Niña stretch from the Pacific shores of South America nearly all the way to the Marshall Islands. Although each La Nina plays out slightly differently than previous ones, this large-scale weather pattern is well-known for bringing colder temperatures to the western half of Canada.

The typical wintertime weather pattern over North America during a La Nina is shown in this illustration. La Nina tends to cause colder weather over western Canada, with wetter conditions near the Pacific coast and around the Great Lakes, with drier and warmer conditions across the southern and southeastern United States. (NOAA Climate.gov)
Despite this, carbon dioxide levels in the atmosphere have already exceeded all previous years. The Keeling Curve, run by the Scripps Institution of Oceanography, is now showing concentrations of over 420 parts per million (ppm) for most of April. While daily CO2 levels managed to spike up above that milestone for a few days in 2021, April 2022 is now the very first time we've seen a monthly average for CO2 greater than 420 ppm. This is alarming not only because we continue to break these records, year by year, but also due to the fact that burning fossil fuels has resulted in more than a 50 per cent increase in CO2 concentrations compared to what they were for thousands of years prior to the Industrial Revolution.
Also, according to a new report from the World Meteorological Organization, the past seven years — 2015 to 2021 — are now confirmed to be the seven warmest years ever recorded.
In their press release, the WMO stated: "2021 was 'only' one of the seven warmest because of a La Niña event at the start and end of the year. This had a temporary cooling effect but did not reverse the overall trend of rising temperatures."

Global temperatures for the month of April, between 1979 and 2022. April 2016, 2020, 2019, and 2017 were all warmer than April 2022, which is tied with April 2010 for 5th warmest. (NOAA NCEI)
Additionally, in 2021, NASA satellites recorded the greatest imbalance for Earth's energy budget in over 20 years. First revealed by climate researcher Leon Simons, and verified by climate scientist Andrew Dessler, the satellite data shows that Earth retained a record amount of excess heat, measured at over 1.5 W/m². While that number appears small, it represents the amount of energy per square metre, so it is multiplied by the entire 510 trillion square metres of Earth's surface. According to Simons, that's "the energy equivalent to 1 million Hiroshima sized atomic bombs every day."
Satellites monitor Earth's energy imbalance by recording how much sunlight the planet receives, and subtracting away how much of that sunlight is directly reflected back into space by clouds and bright surfaces and how much heat radiates away from the top of the atmosphere. The final value factors in both natural causes and emissions from human activities, however, the imbalance has increased significantly over the past 20 years.