After 2023's astounding new global heat record, 2024 may be even worse

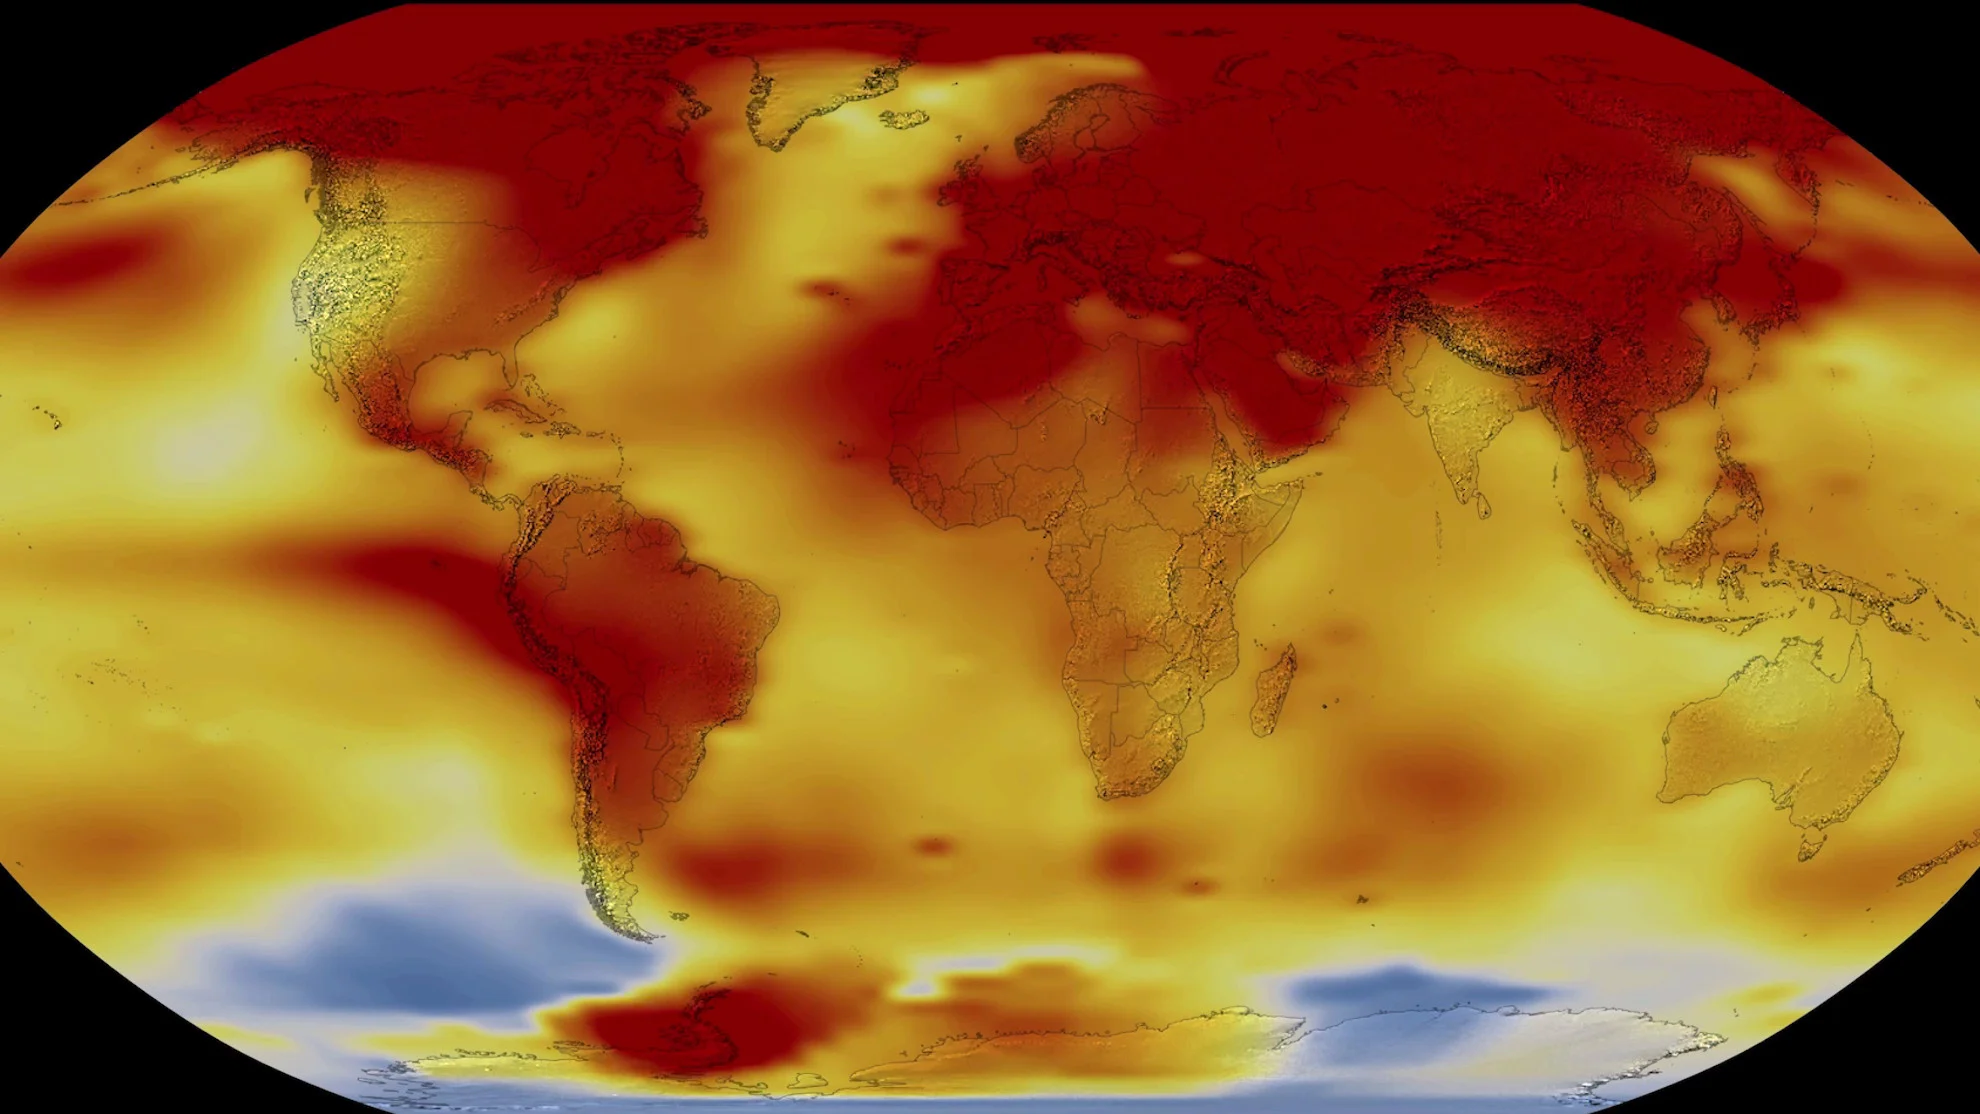
"The exceptional warming that we're experiencing is not something we've seen before in human history," says NASA climate scientist Gavin Schmidt.
The final tally of global temperatures has been collected and analyzed for all of 2023. While the results are no surprise, given what we saw throughout the latter half of the year, they are still quite shocking.
The world's climate institutions all agree. Separate analyses from NOAA, NASA, the Copernicus Climate Change Service, the UK Met Office, the Japan Meteorological Agency, Berkeley Earth, and the World Meteorological Agency all show that 2023 was the hottest year on record.
"After seeing the 2023 climate analysis, I have to pause and say that the findings are astounding," NOAA's Chief Scientist Dr. Sarah Kapnick said in an agency press release on Friday. "Not only was 2023 the warmest year in NOAA's 174-year climate record — it was the warmest by far."

This time-series graph plots global temperatures from 1850-2023 versus the 20th century average. 2023 stands out as the hottest year in that 173-year record. The temperature anomaly label for 2016 has been added to the graph to show how much hotter 2023 is than the previous warmest year on record. Credit: NOAA
Every climate record shows the same thing. 2023 started off on the cool side as La Niña weakened and dissipated. However, as a new El Niño pattern developed to take its place, the extreme heat observed month by month from June through December pushed global temperatures so high that the year ended up smashing all previous records.
"The exceptional warming that we're experiencing is not something we've seen before in human history," says NASA climate scientist Gavin Schmidt. "It's driven primarily by our fossil fuel emissions, and we're seeing the impacts in heat waves, intense rainfall, and coastal flooding."

Monthly temperatures from 1880-2023 are plotted here against the average monthly temperatures between 1951-1980 to provide a seasonal look at how climate change is impacting global heat. Each month from June through December was the hottest in that 143-year historical record, resulting in 2023 being the hottest year as well. Credit: NASA
How warm the year was, exactly, depends on what time period the data is compared against. NOAA's records are plotted versus the 20th Century average (1901-2000), which resulted in a temperature anomaly of +1.18°C. NASA uses a 30-year average that closely matches the 20th century (1951-1980), which revealed that 2023 was 1.2°C above that normal. Copernicus and JMA use the most recent official 30-year average from 1991-2020, a period that was noticeably warmer than the 20th century. Their records plot 2023 at 0.60°C above average (Copernicus) and 0.53°C above normal (JMA).
However, even with these differences between data sets, when viewed together, they all show relatively the same amount of change over time.

The data from the major climate agencies is all plotted here on the same graph, showing how closely they agree with each other when plotted on the same scale and compared with the same base period (1850-1900). Credit: WMO
However, these climate agencies looked farther back to the pre-industrial era to truly assess our impacts on the planet.
NOAA: "the average global temperature for 2023 exceeded the pre-industrial (1850–1900) average by 2.43 degrees F (1.35 degrees C)."
NASA: "Overall, Earth was about 2.5 degrees Fahrenheit (or about 1.4 degrees Celsius) warmer in 2023 than the late 19th-century average, when modern record-keeping began."
WMO: "Six leading international datasets used for monitoring global temperatures and consolidated by WMO show that the annual average global temperature was 1.45 ± 0.12 °C above pre-industrial levels (1850-1900) in 2023."
UK Met Office: "The global average temperature for 2023 was 1.46°C above the pre-industrial baseline."
Copernicus: "The global mean temperature for 2023 is the highest on record, at 0.60°C above the 1991-2020 average and 1.48°C above the 1850-1900 pre-industrial average."
Berkeley Earth: "The global annual average for 2023 in our dataset was estimated as 1.54 ± 0.06°C (2.77 ± 0.11°F) above the average during the period 1850 to 1900, which is traditionally used a reference for the preindustrial period."
According to Berkeley Earth, this is the first time any year has exceeded the key 1.5°C (2.7°F) threshold in their data set.
By "key threshold," they refer to the 1.5°C limit to global warming set by the 2015 Paris Agreement. By keeping global temperatures from permanently exceeding that limit, we can hopefully prevent or reduce the impact of many future climate disasters while also saving many small island nations from being swallowed up by the rising oceans.
The fact that 2023 exceeded that limit in Berkeley Earth's records does not mean that we have now failed in that goal. This should only be a temporary breach.
However, due to the strong El Niño pattern in the equatorial Pacific, there's a reasonable chance this year will be even warmer than the last.

The current El Niño stretches across the equatorial Pacific Ocean, while much of the global ocean is also experiencing warmer than average conditions. Credit: NOAA Climate.gov
"The shift from cooling La Niña to warming El Niño by the middle of 2023 is clearly reflected in the rise in temperature from last year," WMO Secretary-General Prof. Celeste Saulo said in a press release. "Given that El Niño usually has the biggest impact on global temperatures after it peaks, 2024 could be even hotter."
This was the case in 2015 and 2016, during the last strong El Niño. 2015 ended as the hottest year on record at the time. By the time 2016 was over, global temperatures had beaten out the previous year, and 2016 remained the hottest year on record until now.
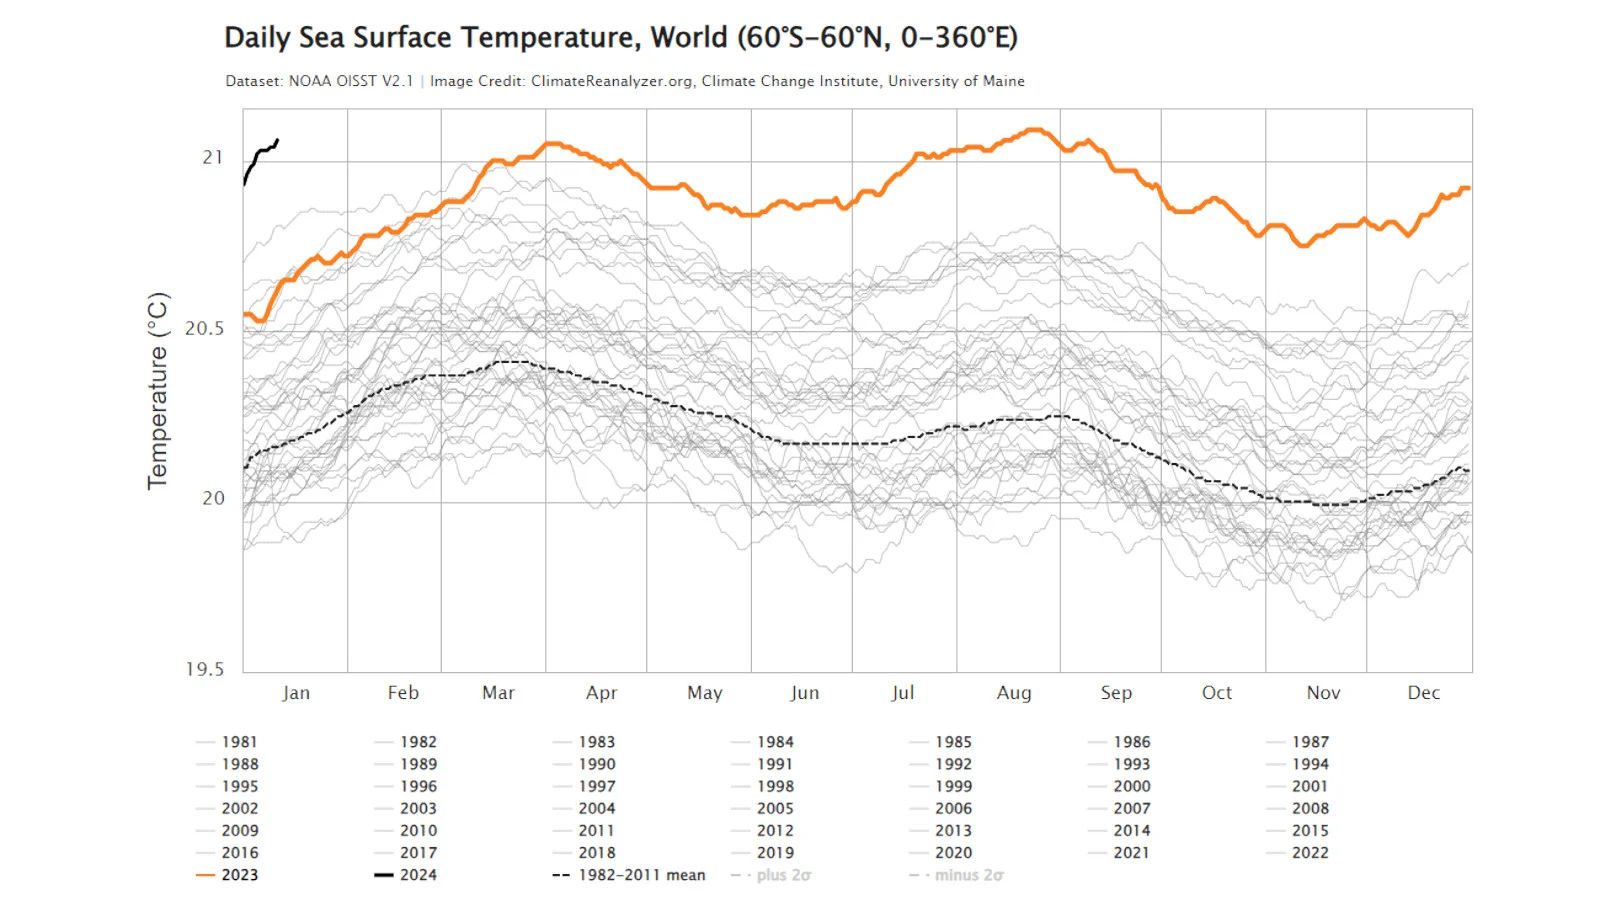
This plot of daily sea surface temperatures shows that the global ocean from 60°S to 60°N latitude is already half a degree C warmer than it was on the same day last year, at 21.1°C. That is also the maximum recorded temperature seen in the world's oceans in 2023 (the peaks in both April and August). Credit: Climate Reanalyzer
So far in 2024, global ocean temperatures are already continuing the warm trend seen throughout most of 2023. As shown above, on January 11, 2024, the daily sea surface temperature was 21.1°C — setting a new record for the day at 0.5°C warmer than it was on January 11, 2023, and 0.3°C warmer than the previous record set on that same day in 2016.
However, that also matches the maximum record sea surface temperatures set last year, on April 1-6 and August 13-31. Thus, as we track towards the next ocean maximum temperature in late March/early April, during early southern autumn, and then experience the second peak in late northern summer, it's very likely we are about to see some alarming new ocean temperatures.
Based on all the current known factors — what happened last year, what conditions are like right now, the major weather patterns compared to previous years, and El Niño's influence — Berkeley Earth is already giving 2024 better than even odds of becoming the next hottest year on record.
"We predict a 58 per cent chance that 2024 is warmer than 2023 and 97 per cent chance that it is at least as warm as 2016, making it very likely that 2024 will become either the warmest or 2nd warmest year on record," they wrote.