Carbon dioxide now at record levels not seen in over 4 million years

CO2 concentrations have never been as high as they are now, during the entire existence of humans on this planet, and also going back millions of years.
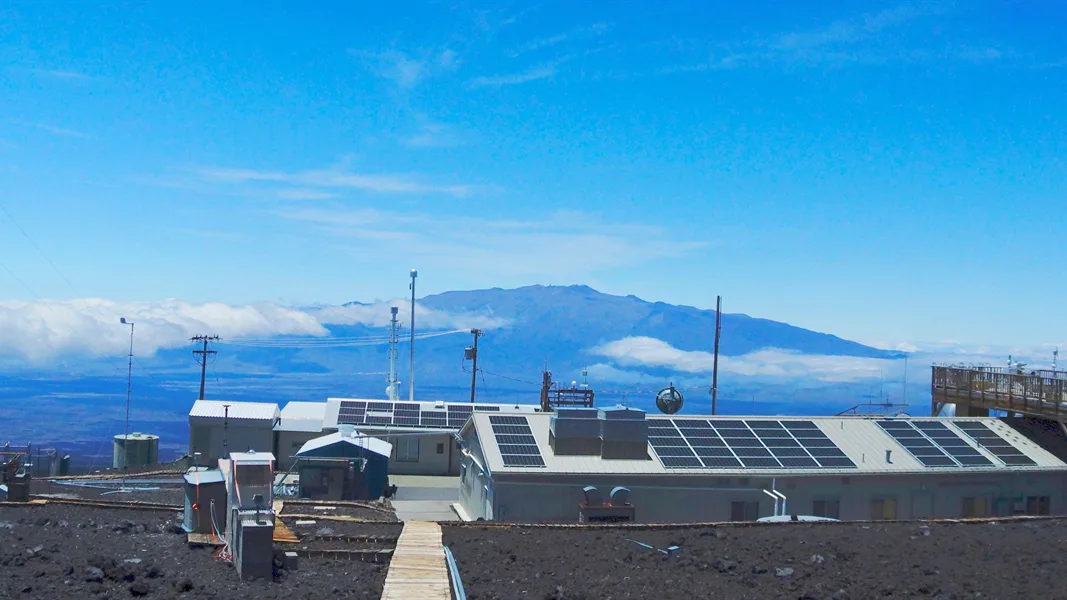
High atop the remote peak of Mauna Loa in Hawai'i, scientists have recorded the highest carbon dioxide concentrations ever seen.
Roughly one year ago, daily carbon dioxide levels measured at NOAA’s Mauna Loa Atmospheric Baseline Observatory reached 420 parts per million (ppm) for the first time ever, on April 20, 2021. This was a new high for the 63-year record of the Keeling Curve. Additionally, it also represented CO2 concentrations higher than any on Earth throughout human history.
In 2022, daily measurements for CO2 at Mauna Loa climbed to an even higher maximum, reaching a peak of 421.68 ppm on May 13. On June 3, the Scripps Institution of Oceanography announced that the average CO2 concentration for the entire month of May had reached 420.78 ppm — the highest recorded monthly average for carbon dioxide at Mauna Loa since measurements began in 1958. Based on their own instruments at that location, NOAA reported a monthly average of 420.99 ppm.
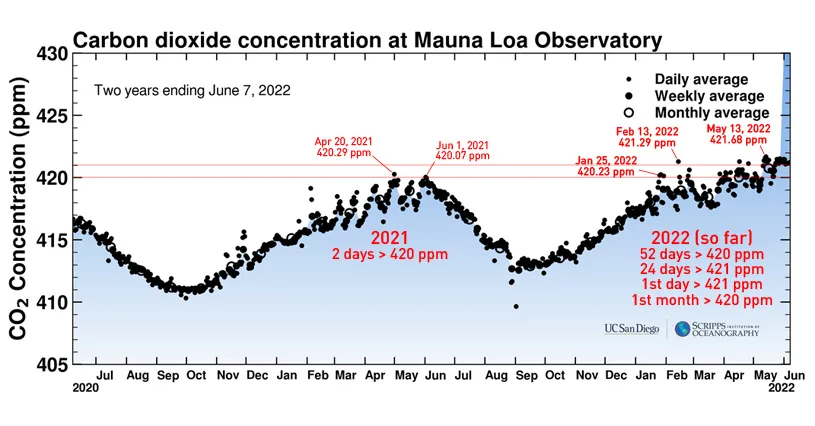
This two-year plot of the Keeling Curve shows carbon dioxide concentrations from June 8, 2021 to June 7, 2022. With regards to the levels reached, the timing of these exceedances, and the number of days exceeding, 2022 is breaking all previous records. (Scripps Institution of Oceanography/Scott Sutherland)
A concentration ticking upwards by a little over 1 part per million is not a big increase, year over year. However, the timing of the peaks this year, as well as the number of days that peaked above previous thresholds, is quite significant.
In 2021, CO2 was recorded above 420 ppm on just two days out of the year — April 30 and June 1.
In 2022, the earliest daily measurement to exceed 420 ppm at Mauna Loa was on Jan. 25, over three months earlier than in 2021. On Feb. 13, CO2 levels spiked even higher, exceeding 421 ppm for the first time ever in the 64 years since monitoring began.
So far this year, as of June 6, carbon dioxide levels at Mauna Loa have topped 420 ppm for a total of 52 days. On 24 of those days, concentrations exceeded 421 ppm.
This has resulted in the very first monthly averages higher than 420 ppm, in both April and May.
"It's depressing that we've lacked the collective willpower to slow the relentless rise in CO2," Scripps geochemist Ralph Keeling stated in a press release. Keeling manages the Keeling Curve, which has logged carbon dioxide concentrations at Mauna Loa since 1958 and was named for his father, Charles David Keeling.
"Fossil-fuel use may no longer be accelerating, but we are still racing at top speed towards a global catastrophe," Keeling added.
Based on studies of ice cores and past climate, carbon dioxide levels in the air have never been as high as they are now, during the entire existence of humans on this planet. In fact, according to Scripps, the last time CO2 would have been this high in the past was roughly 4.1-4.5 million years ago, during the Pliocene Climatic Optimum.
"During that time, sea levels were between five and 25 metres (16 and 82 feet) higher than today, high enough to drown many of the world's largest cities," the Scripps press release explained. "Temperatures then averaged 14 degrees Celsius (7 degrees Fahrenheit) higher than in pre-industrial times, and studies indicate that large forests occupied today's Arctic tundra."
"Carbon dioxide is at levels our species has never experienced before — this is not new," Pieter Tans, a senior scientist at NOAA's Global Monitoring Laboratory, stated in the press release. "We have known about this for half a century, and have failed to do anything meaningful about it. What's it going to take for us to wake up?"
CO2 SEASONAL CYCLE
Carbon dioxide levels in the atmosphere follow a fairly regular pattern, year by year. They track closely with the seasons in the northern hemisphere, rising through fall, winter, and early spring, and then decreasing through late spring and summer. This is due to there being more land mass in the northern hemisphere, and thus more plant life.
So, generally, we see the year's highest CO2 levels in May or early June.
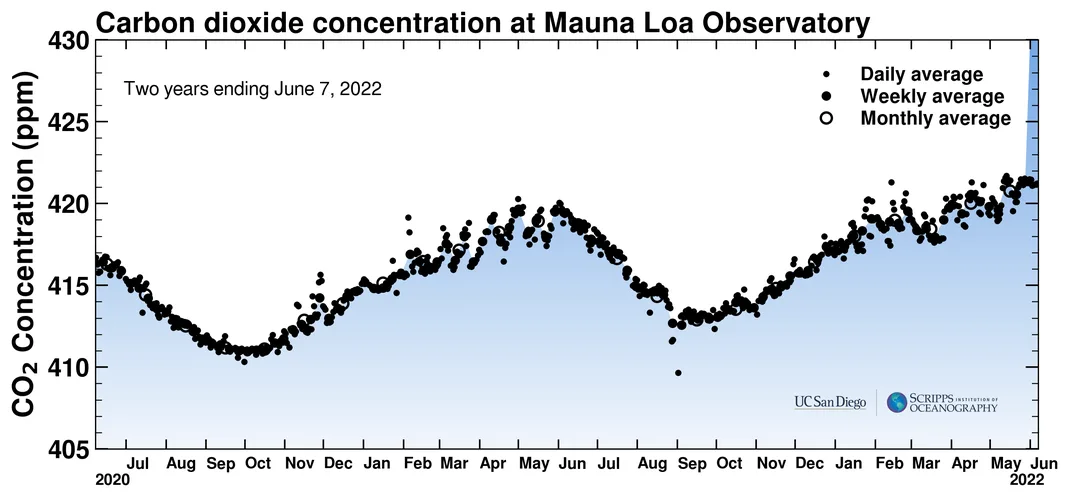
The two-year Keeling Curve, as of June 7, 2022, reveals the saw-tooth pattern of carbon dioxide measurements throughout a year. (Scripps Institution of Oceanography)
As the graph above shows, not only do CO2 levels rise and fall with the seasons, each year's maximum and minimum is higher than the last. This yearly increase is a direct result of the burning of fossil fuels.
The full data record from Mauna Loa, from 1958 to the present day shows this pattern even better.
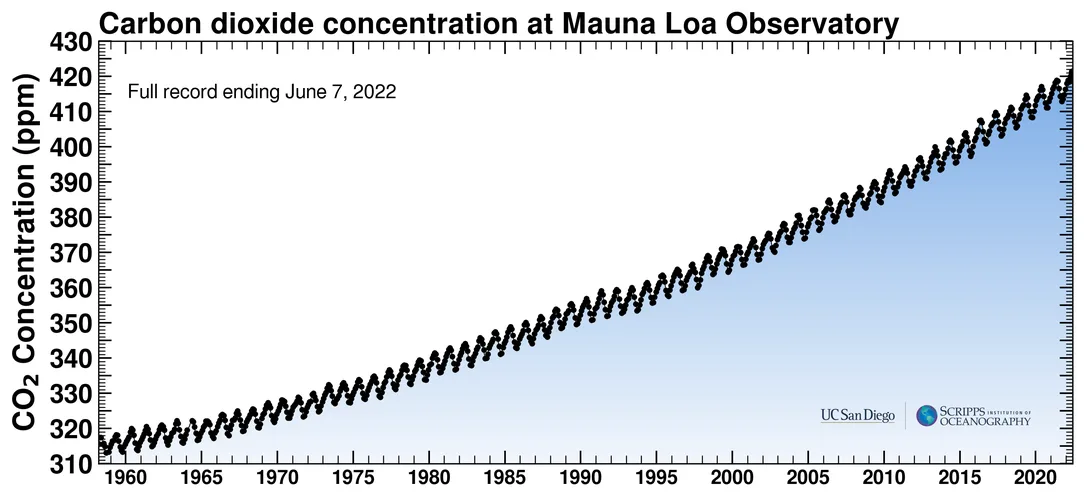
(Scripps Institution of Oceanography)
The concentration of carbon dioxide in the atmosphere is measured in 'parts per million' or ppm. A value of 420 parts per million means that for every million molecules of the atmosphere, 420 are carbon dioxide molecules. That may not seem like much, but there are roughly 100 tredecillion (100,000,000,000,000,000,000,000,000,000,000,000,000,000,000) molecules in Earth's atmosphere. So that adds up to a lot of carbon dioxide.
WHY IS CARBON DIOXIDE SO IMPORTANT?
Carbon dioxide is considered to be the 'global climate thermostat' for planet Earth. That means even though it only represents a small percentage of Earth's atmosphere, the abundance of this one gas is the primary controller of the planet's surface temperature and thus its climate.
Most of Earth's atmosphere — the 99.9 per cent made up of oxygen, nitrogen, and argon — absorbs neither incoming solar radiation nor the infrared radiation emitted by Earth's surface. If the atmosphere was only made up of just those three gases, the heat radiating away from Earth's surface would escape into space just as quickly as solar radiation was absorbed. As a result, Earth would be a substantially colder planet; perhaps up to 30°C colder, overall.
Carbon dioxide allows incoming sunlight to pass by it unaffected, but it absorbs the heat radiating away from the ground. Because this is similar to how a greenhouse works — the glass in a greenhouse allows most light and radiation through, but reflects infrared away — this is known as the greenhouse effect, and CO2 is labelled as a greenhouse gas.
So, with just a trace amount of CO2 in the atmosphere (around 0.04 per cent of the total), enough heat is trapped in the atmosphere that the planet stays warm enough for life to take hold and for human civilization to flourish. Adding more CO2 to the air, incidentally, causes more heat to be trapped than normal. This is why we are seeing a fairly steady rise in temperatures since the beginning of the Industrial Revolution, when we started burning tons of coal, oil, and gas.
Watch below: NASA climate scientist Bill Putman explains the yearly waxing and waning of carbon dioxide throughout a year
The other major greenhouse gases that contribute to Earth's surface temperature are water vapour, methane, nitrous oxide, and ozone. None of these control Earth's climate as effectively as CO2, though. There's one straightforward reason for this: Carbon dioxide is the most abundant temperature-independent greenhouse gas in Earth's atmosphere.
Compared molecule to molecule, methane, ozone, and nitrous oxide are more potent greenhouse gases than CO2. However, carbon dioxide is far more abundant in the atmosphere than these other gases. Thus it still has a more significant contribution to global warming.
Water vapour is a special case. It is not only a more potent greenhouse gas than carbon dioxide, it is also more abundant. But, water vapour's presence in the atmosphere and its contribution as a greenhouse gas are entirely dependent on the temperature. Lower the temperature by a certain amount and water vapour will condense into liquid water, forming clouds and precipitation. Lower the temperature even further and the water freezes solid.

The Mauna Loa Observatory, high atop the volcano in Hawai'i, is a remote enough location from sources to give us an excellent idea of the carbon dioxide concentrations in the northern hemisphere of Earth. (NOAA)
Carbon dioxide, on the other hand, remains in gaseous form with its full potency as a greenhouse gas for the entire range of temperatures experienced on Earth. While CO2 freezes at -78.5°C, and we've seen temperatures lower than that in Antarctica, the carbon dioxide would need to be more concentrated for it to freeze out of the air on its own.
The very reason we have large quantities of water vapour in Earth's atmosphere in the first place is due to this temperature-independence of carbon dioxide. If the amount of CO2 in the air decreases, the planet cools, which causes more water vapour to condense out of the air and eventually freeze.
This is how some glacial periods in Earth's history began: CO2 was removed from the air by various forms of life, which locked it up in minerals or buried it in large quantities. As the concentration of greenhouse gases fell, the planet cooled, resulting in more snow and ice, which reflected more sunlight back into space, and the temperature fell even more. Ultimately, this caused the formation of immense glaciers that covered much of Earth's surface.
When carbon dioxide levels rose again, due to events such as extreme volcanic events or mass die-offs in the ecosystem, the planet warmed and the ice age ended.
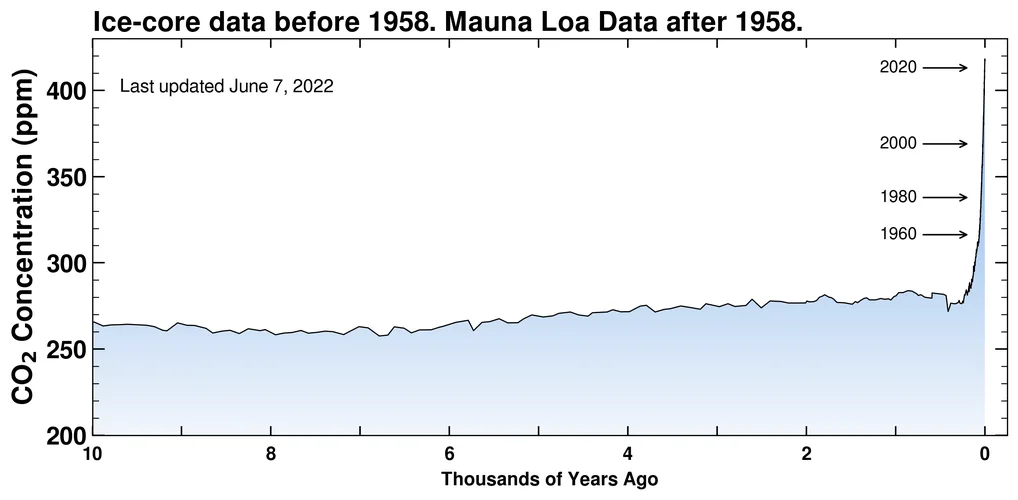
By measuring gases trapped in ice cores, scientists have shown what carbon dioxide levels were like in the atmosphere, going back 10,000 years. (Scripps Institution of Oceanography)
In the roughly 10,000 years before the industrial revolution, CO2 levels were reasonably uniform at around 265 ppm. As a result, Earth's climate remained relatively stable. The greenhouse gases in the air absorbed just enough of the heat Earth radiated out towards space to keep the planet's average temperature reasonably steady. This allowed human civilization to thrive.
As shown in the graph below, due to carbon dioxide emissions from fossil fuel burning, the global average temperature has risen by roughly 1.5°C since the early 1900s.
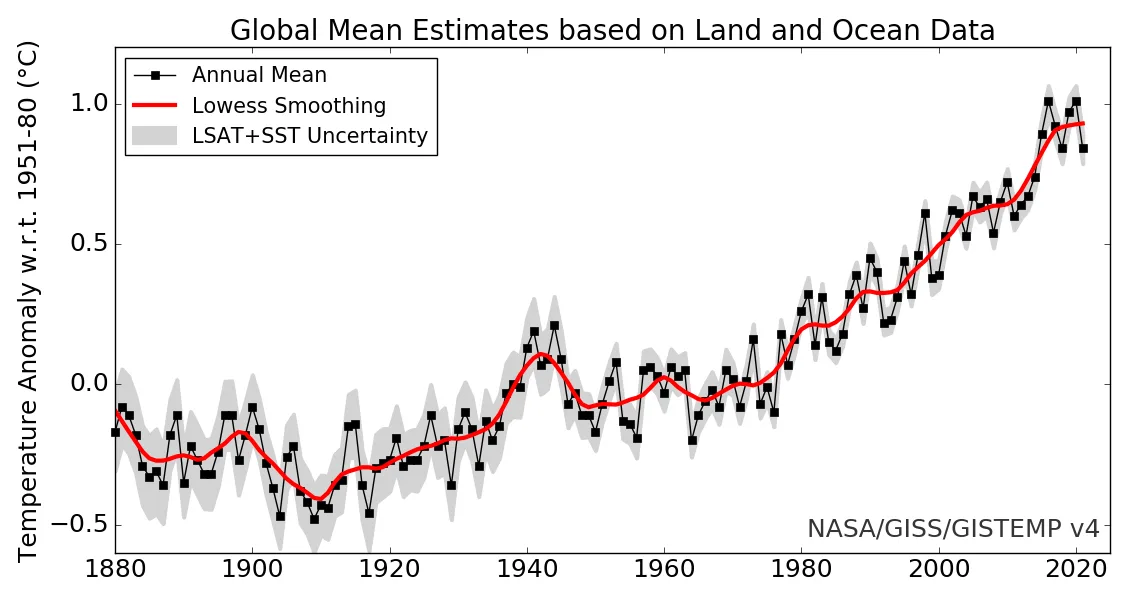
(NASA's Goddard Institute for Space Sciences)
Seeing this kind of temperature increase in a small region, over a short period of time, such as in the local forecast for your city over a few days, is not much of a concern. It represents only a small amount of energy and the temperature will eventually go down by that much, as well.
The entire planet warming up by over one degree, however, and in such a way that the temperature will not go down again by that amount for the foreseeable future, represents an immense amount of energy being invested into our weather and climate systems.
This is of great concern to us when it comes to severe weather events and their potential impact on human civilization. It is going to be even worse going forward, as greenhouse gas emissions continue to increase and the temperature continues to rise along with them.