Warming stripes show over 100 years of climate change at a glance

A British climatologist who wanted to illustrate climate change in a clear and simple way created the “warming stripes.” The overly simplified visual representation went viral.
Ed Hawkins from the University of Reading knows there are many sources of complex information that provide detailed evidence of climate change. His warming stripes, according to the #ShowYourStripes website, have a different objective: “These graphics are specifically designed to be as simple as possible, and to start conversations about our warming world.”
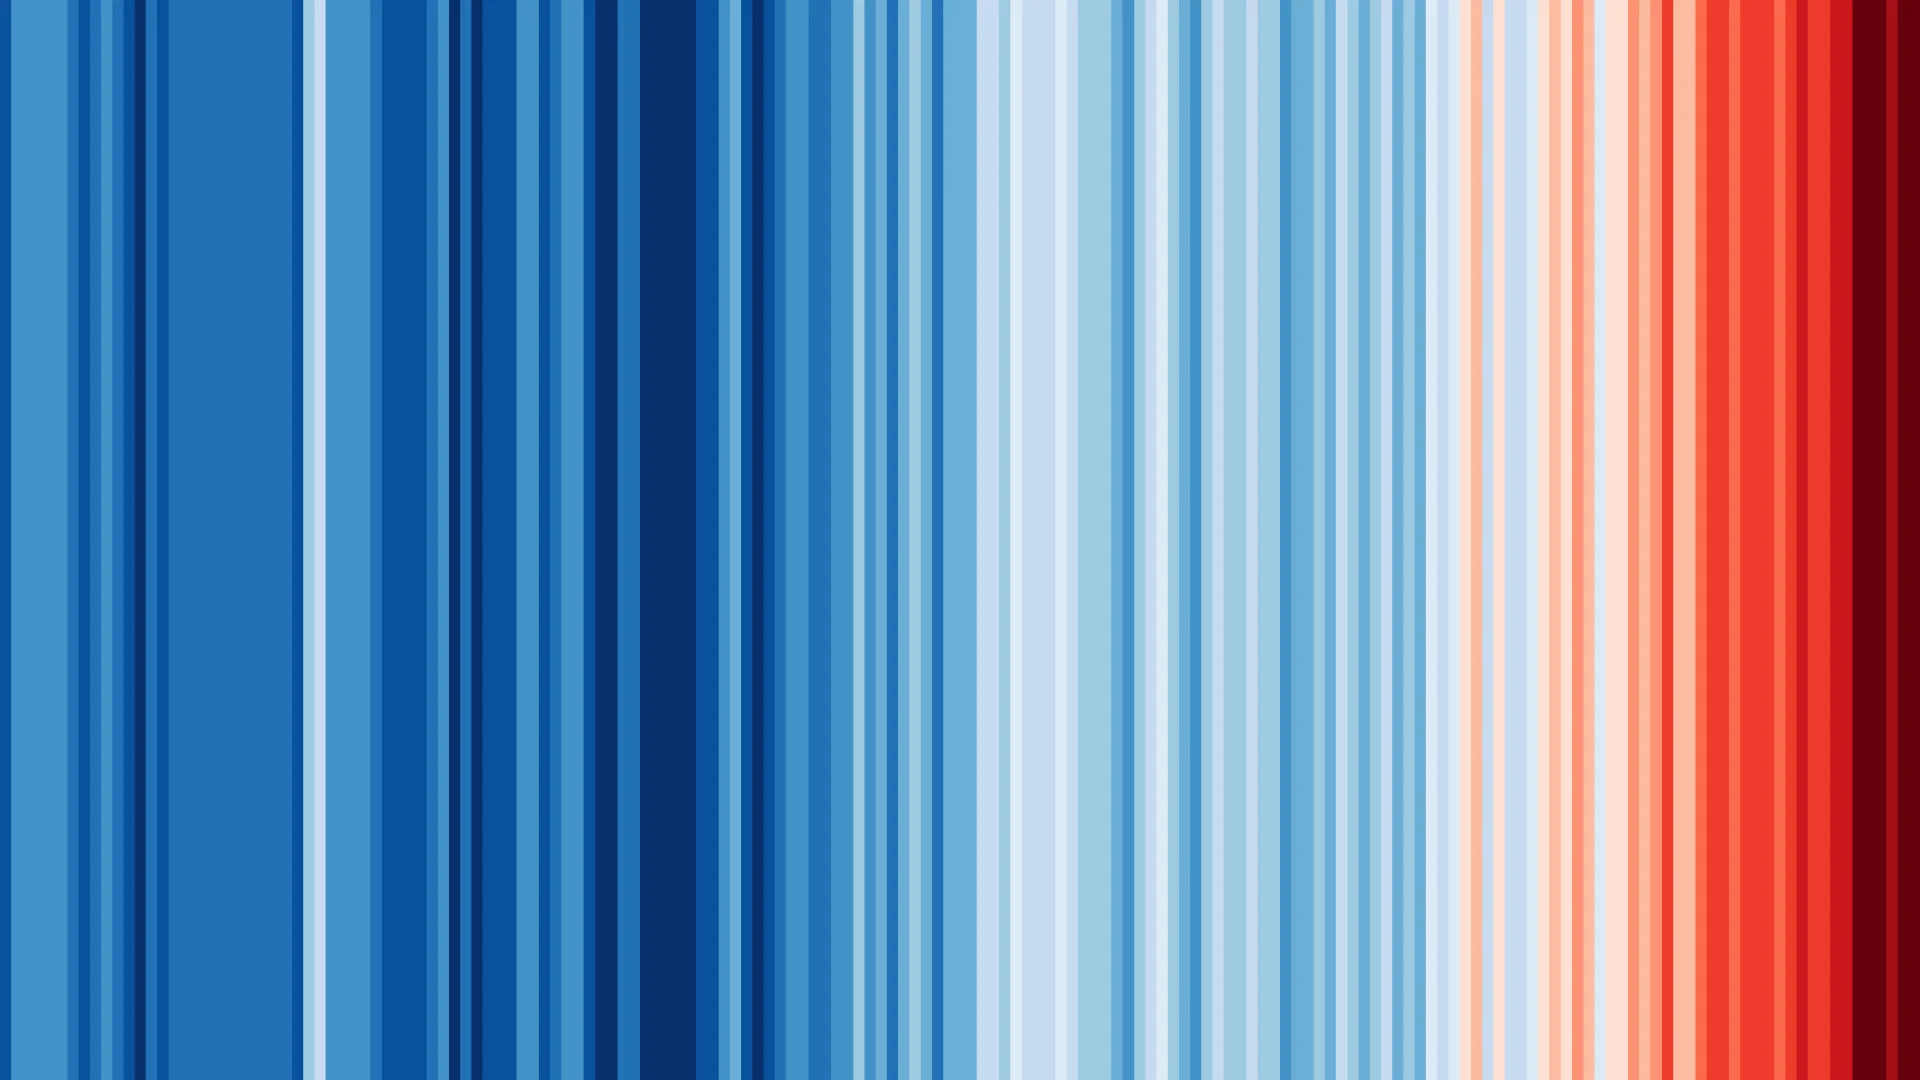
Put simply, the warming stripes are a chronological visual representation of “the change in temperature as measured in each country over the past 100+ years.” To achieve the illustration of the climate, Hawkins compared the average temperature of one year on Earth with the climatological average of the planet between 1971 and 2000 (this permitted a base average for comparisons).
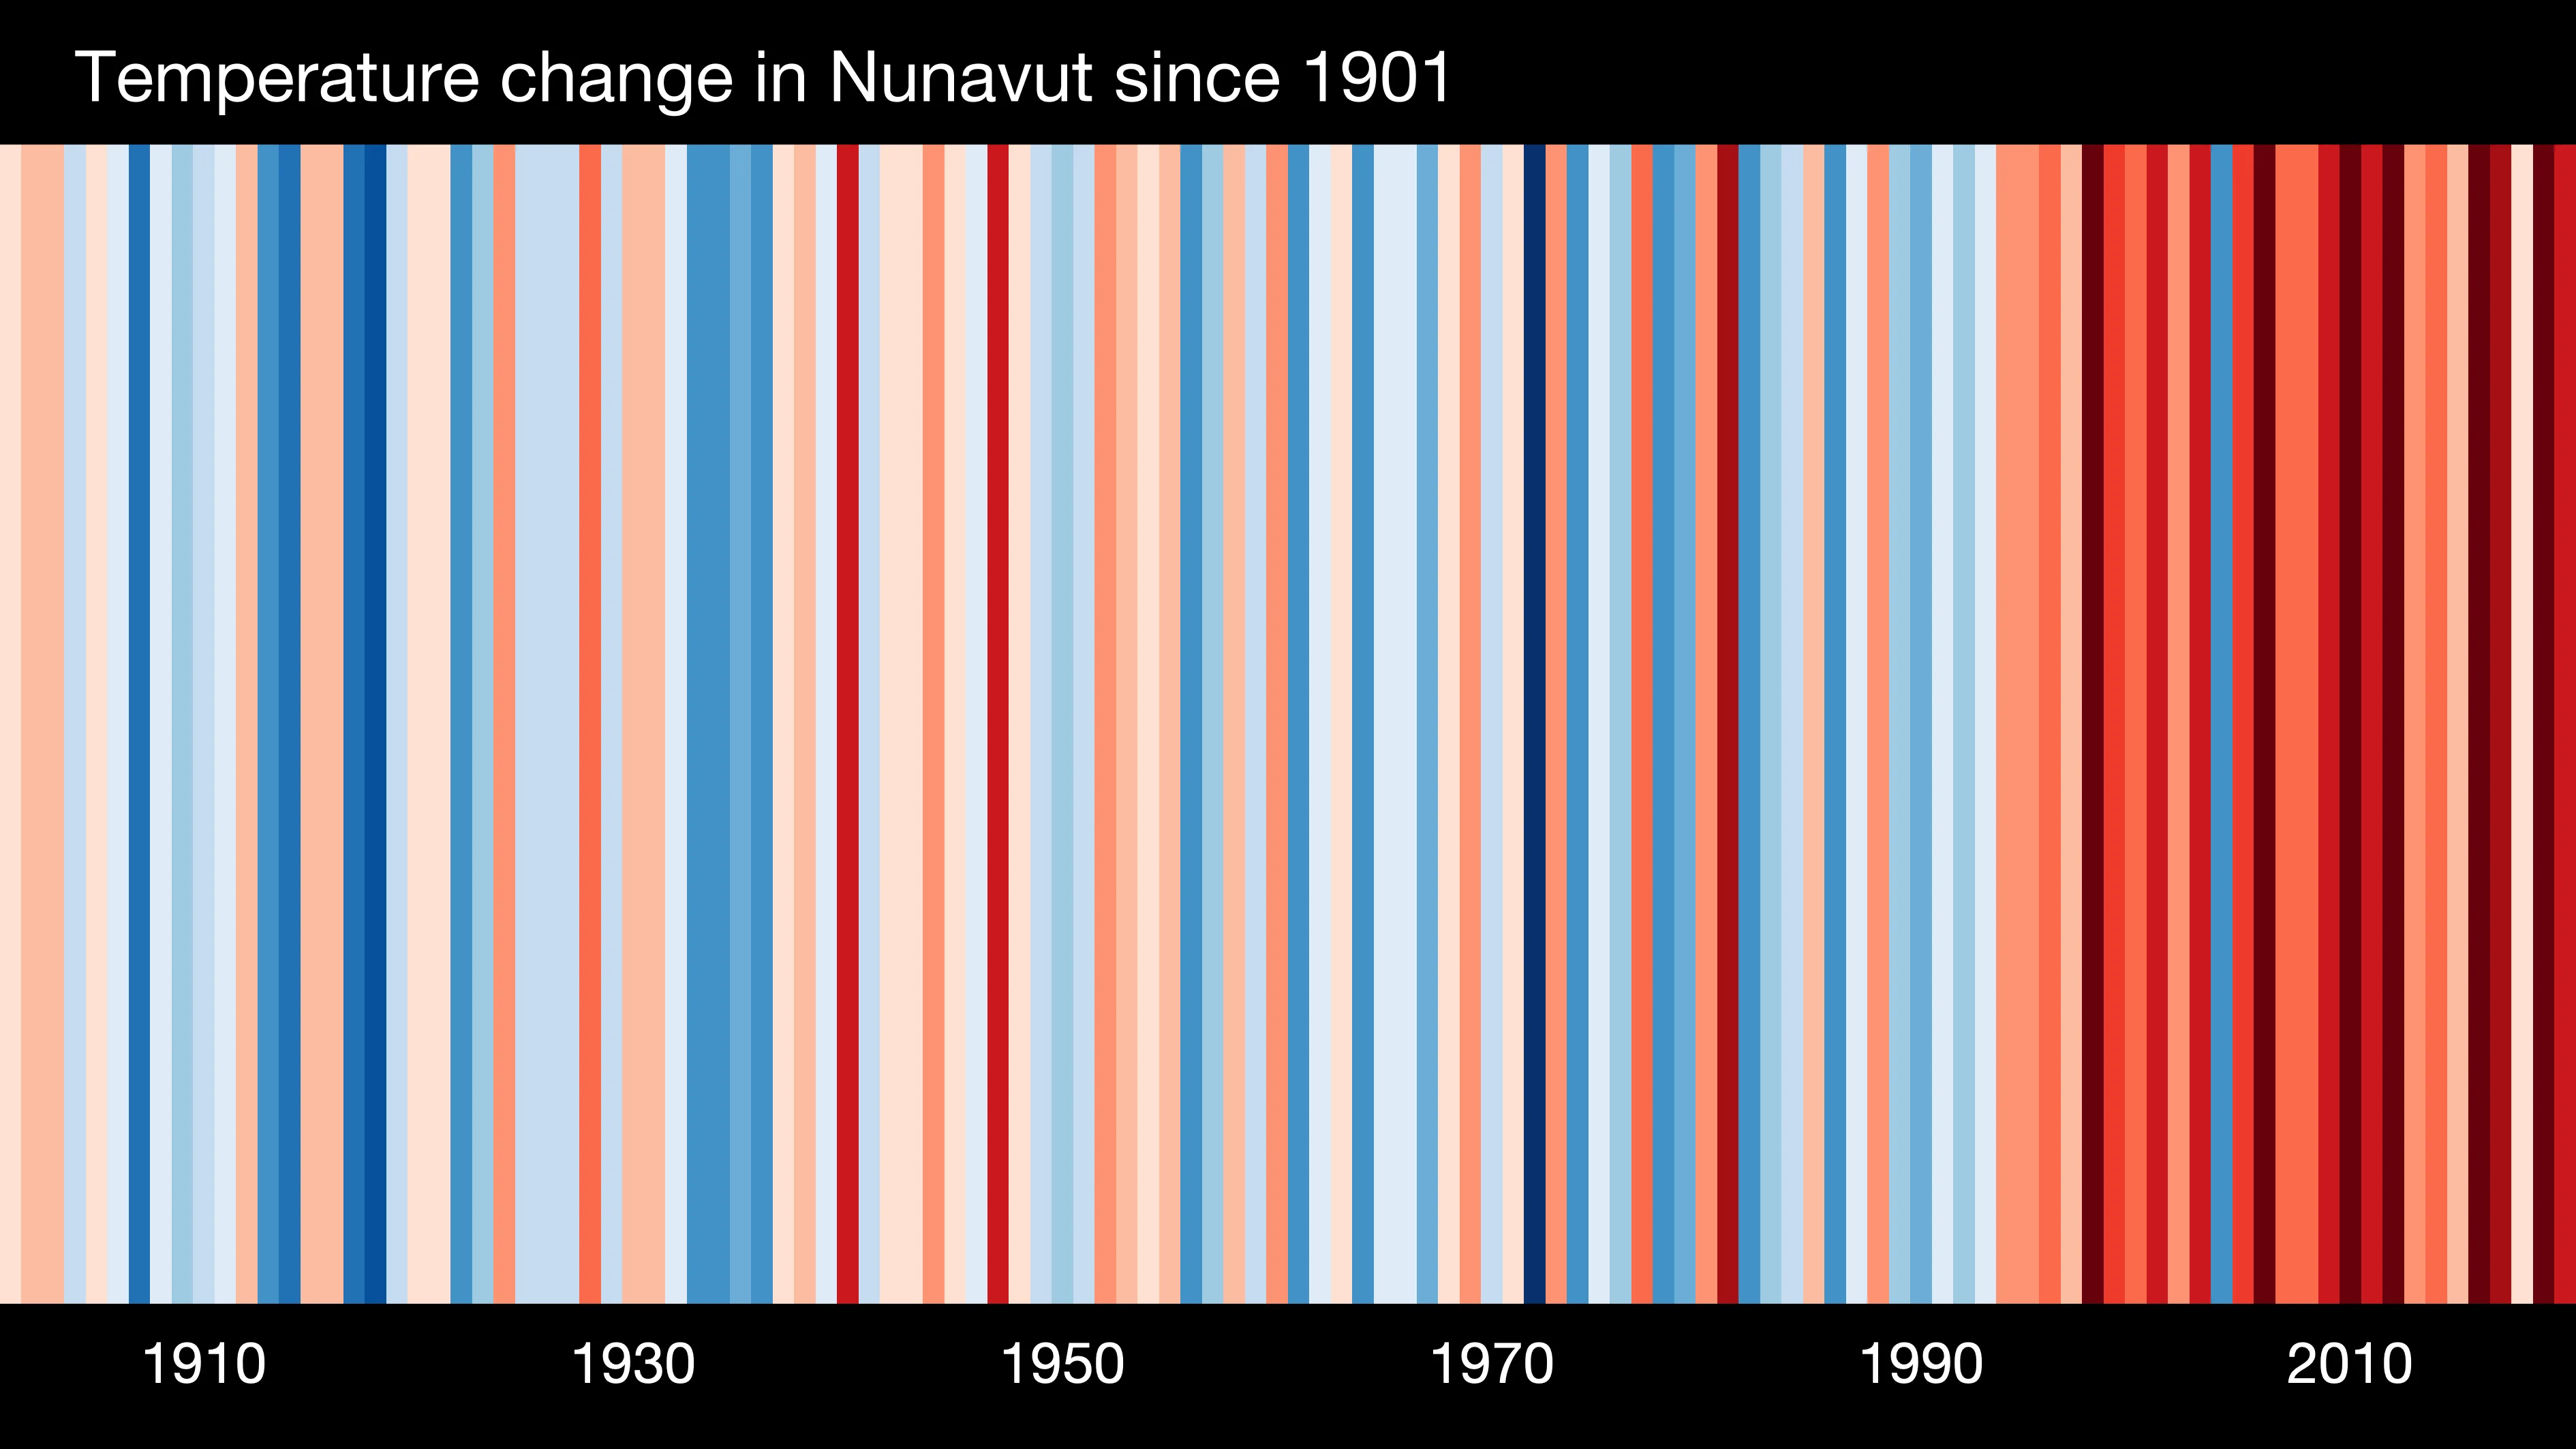
Warming stripes for Nunavut from 1901-2020. (Professor Ed Hawkins/University of Reading. CC BY 4.0)
For each year in which the average temperature is below the 1971–2000 average, he draws a vertical stripe with a bluish tint. If this temperature is higher than this same average, then the illustration displays a red band—the darker the stripe, the cooler or warmer the year, compared to the base average. Arranging all the colored bands side by side gives you a quick overview of how the Earth's climate has changed over time.
RAISING AWARENESS
Every year on June 21, the day of the summer solstice in the Northern Hemisphere, hundreds of weather presenters and meteorologists present their “warming stripes” to their audiences during daily bulletins and take the opportunity to raise awareness for climate change. This act draws upon the significance of the message behind Hawkins’s visual representation and the prevailing dialogue that identifies climate change as such a pressing issue.
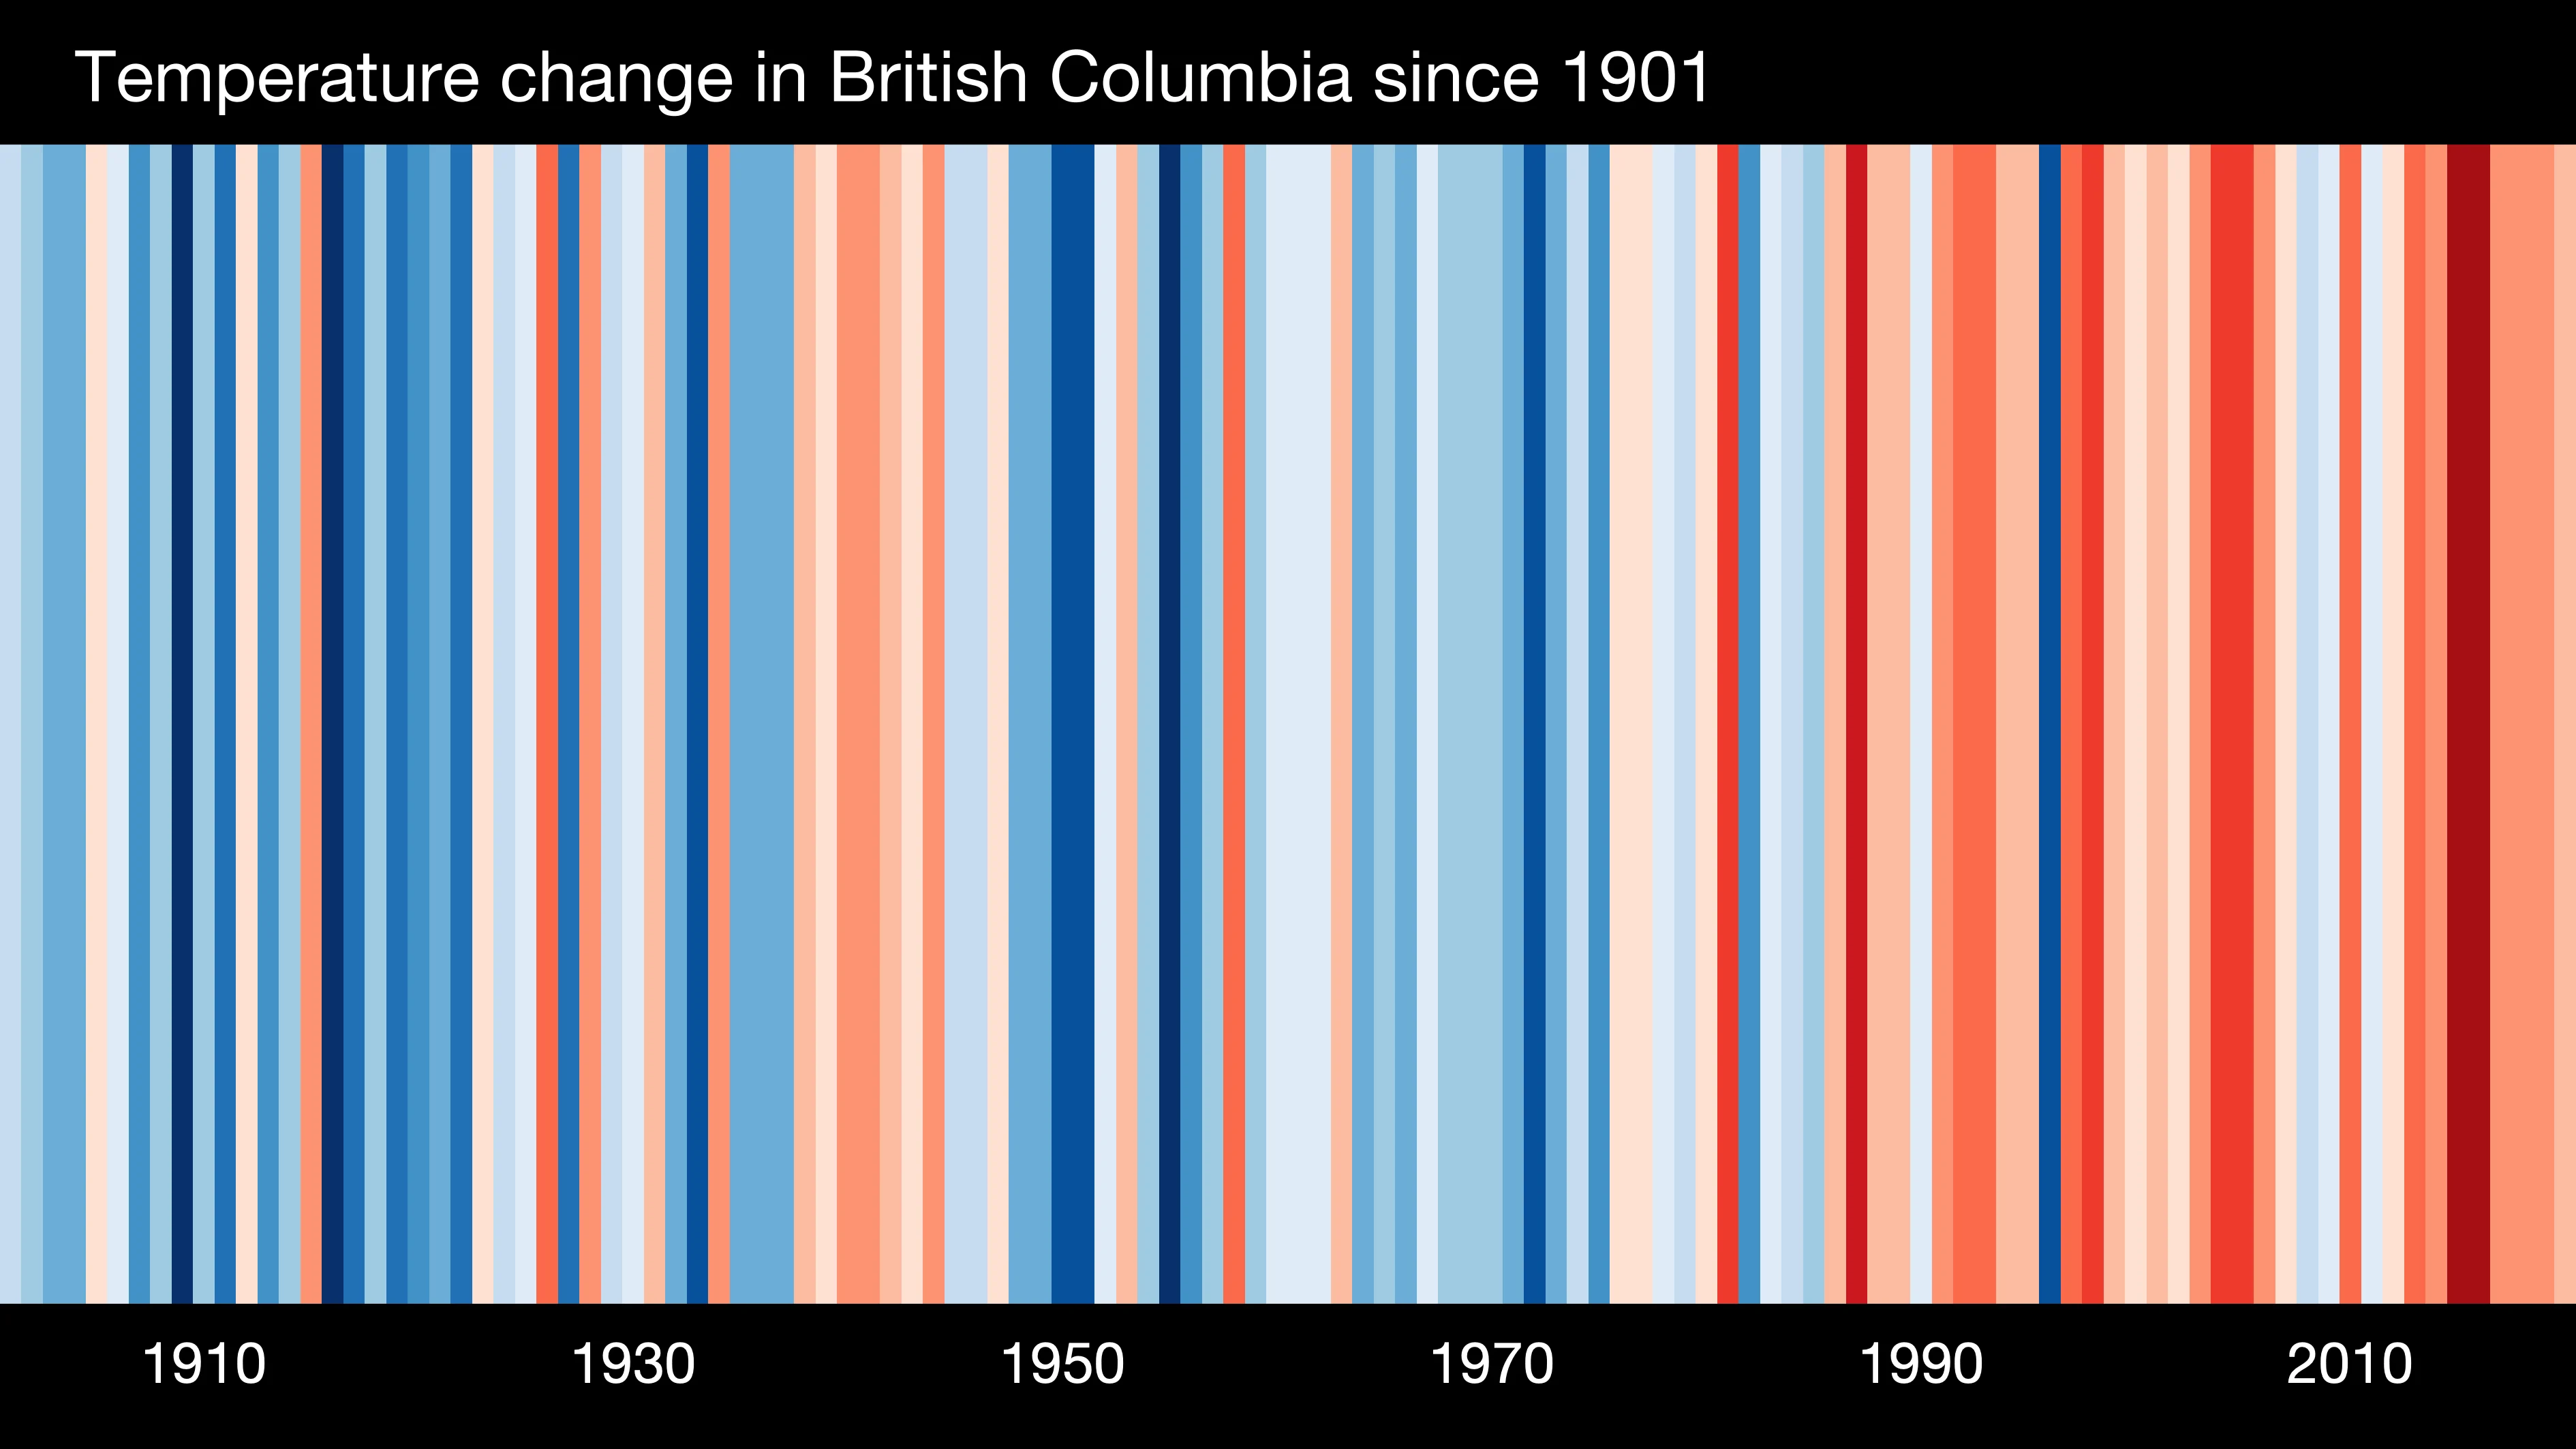
Warming stripes for British Columbia from 1901-2020. (Professor Ed Hawkins/University of Reading. CC BY 4.0)
In 2015, when the Paris Agreement was signed, countries pledged to review their carbon dioxide emissions reduction targets every five years in order to mitigate the impacts. In 2020, this was to take place during the annual climate negotiations organized by the United Nations Conference of the Parties (COP), but was cancelled due to the pandemic.
Since then, as The Weather Network reported in 2022, at "COP26 in Glasgow, Prime Minister Justin Trudeau announced that he would impose a ceiling on fossil fuels. [At COP27], the Joint Declaration from Energy Importers and Exporters on Reducing Greenhouse Gas Emissions from Fossil Fuels was signed by Canada, the United States, Great Britain, the European Union, Japan, Singapore, and Norway."
“Show Your Stripes Day” falls on June 21 to highlight the importance of the COP climate negotiations and underline the fact that every year is a pivotal one for the fight against climate change.
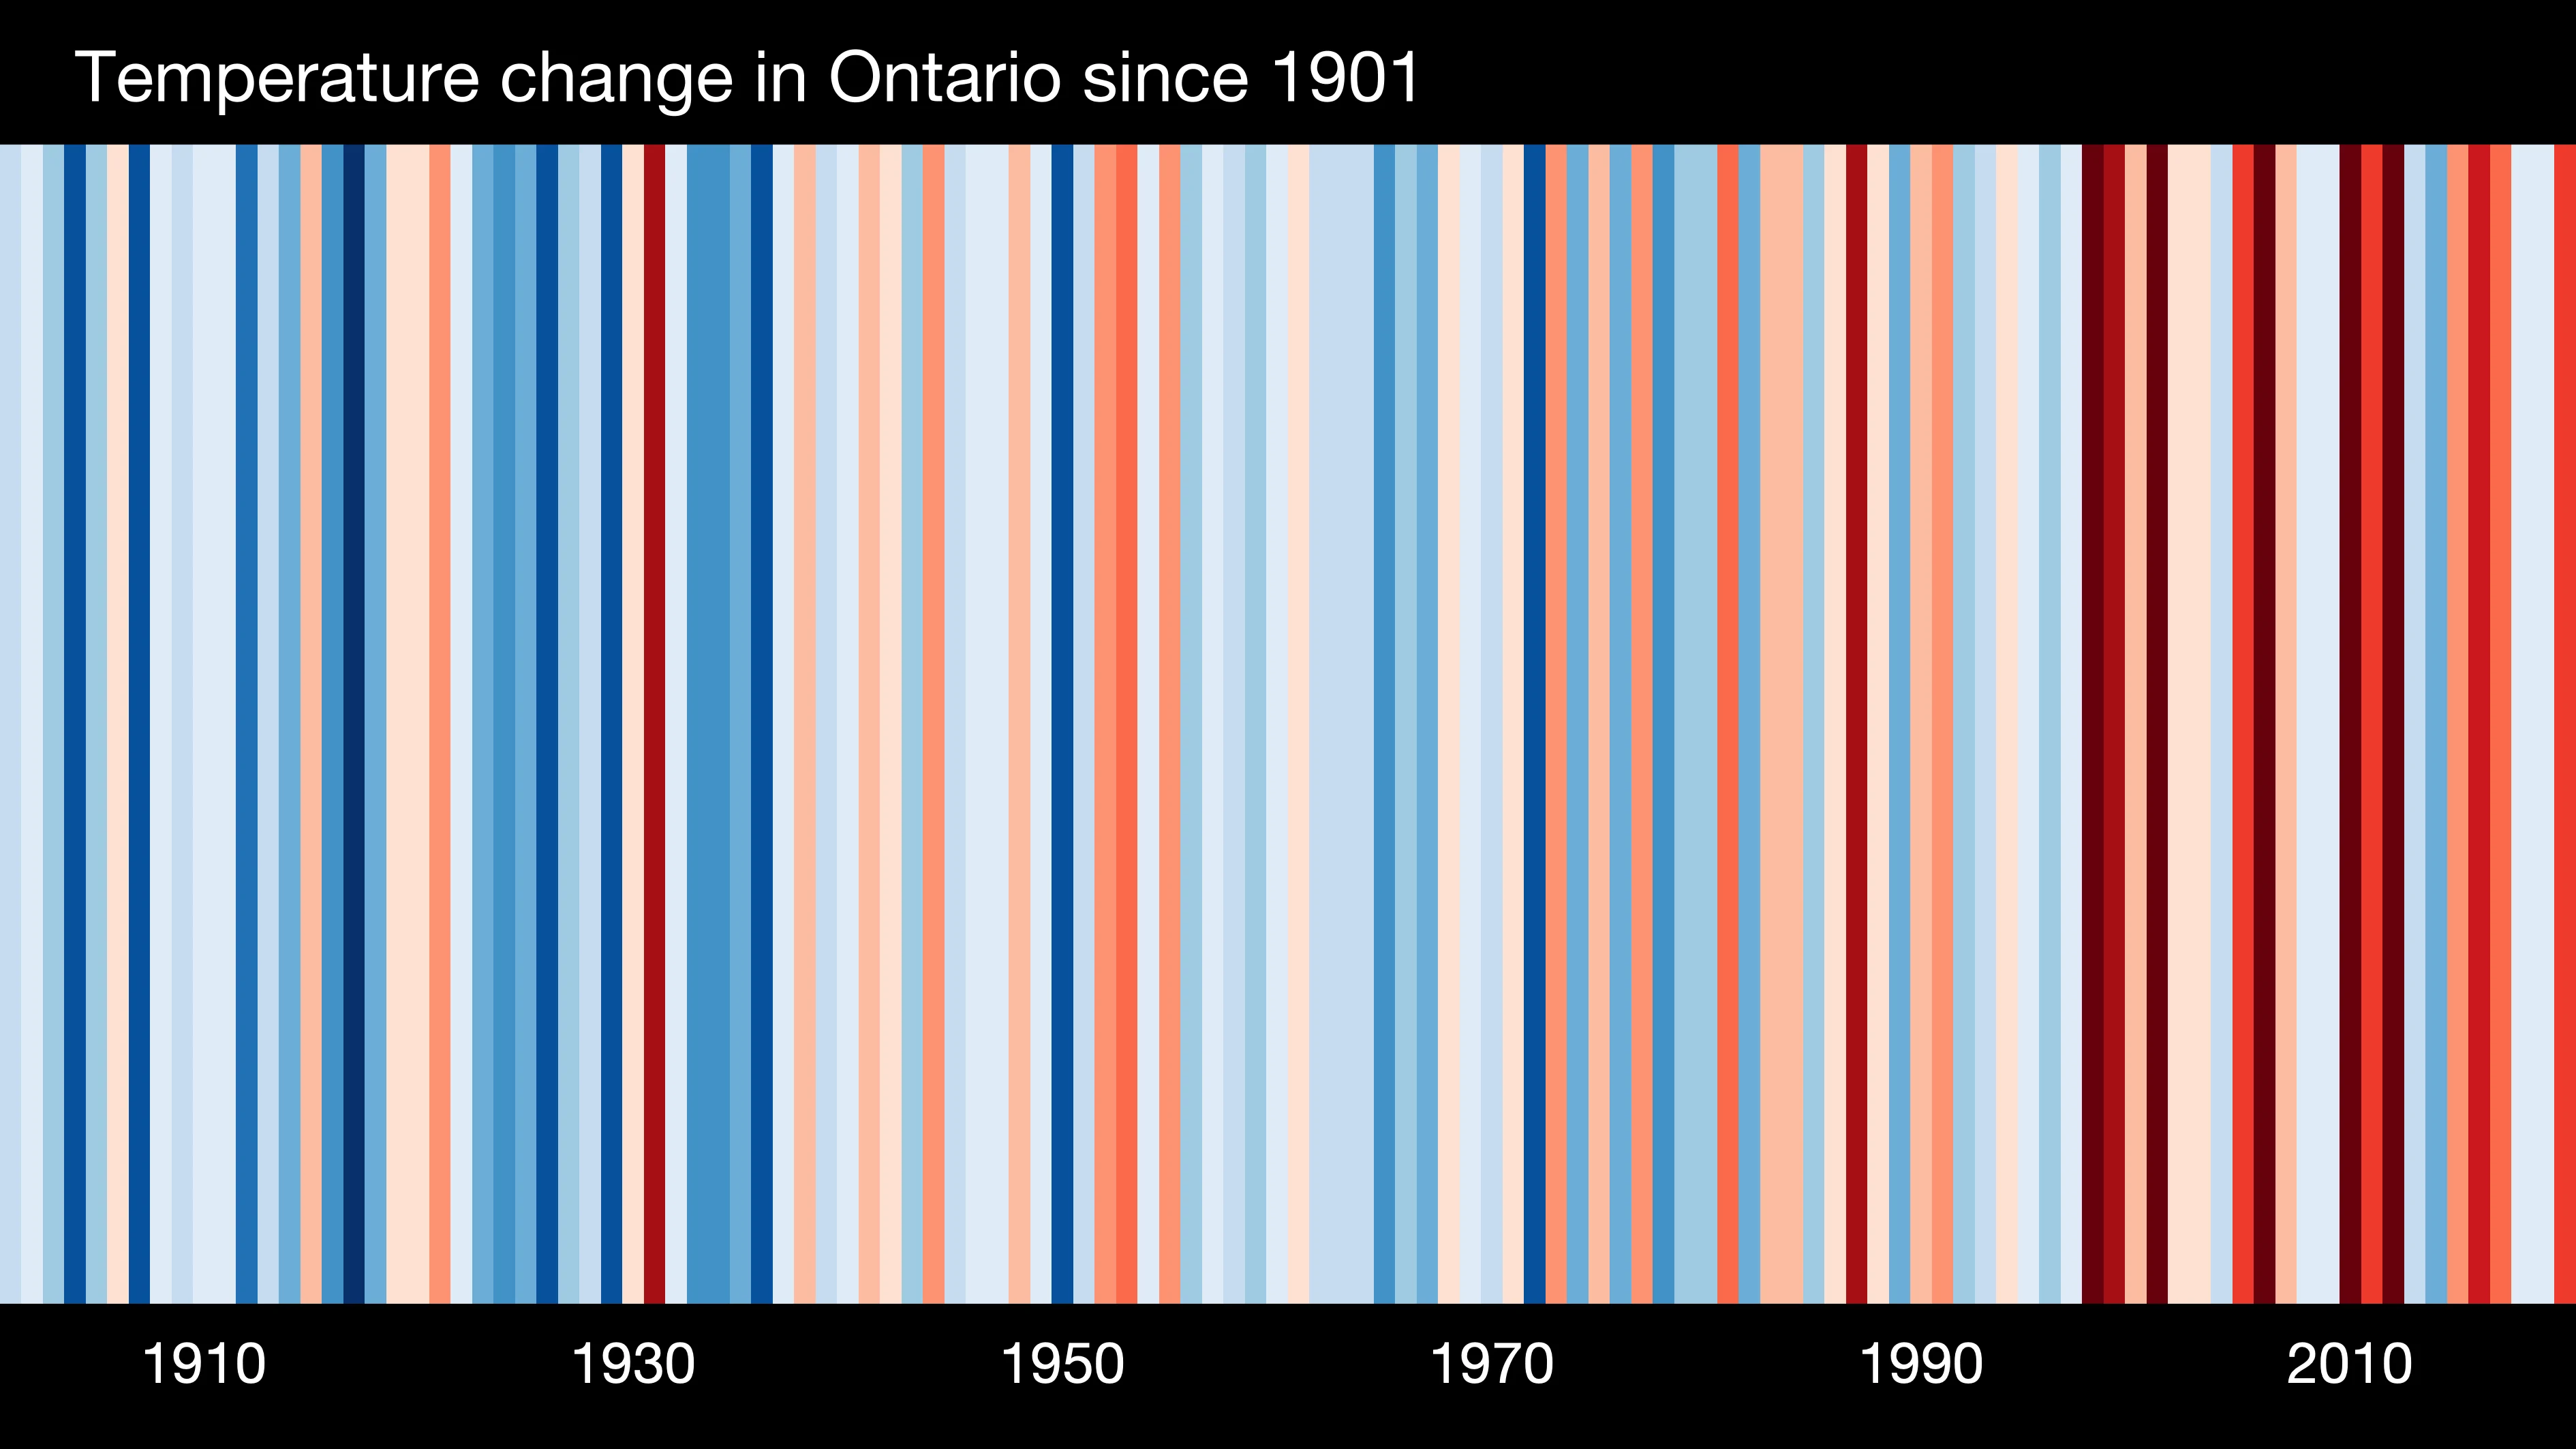
Warming stripes for Ontario from 1901-2020. (Professor Ed Hawkins/University of Reading. CC BY 4.0)
EVERYONE HAS THEIR OWN “WARMING STRIPES”
Hawkins’s warming stripes have become so popular with meteorologists and weather presenters around the world, Hawkins was asked by climatologists to make local case studies depicting the warming trend for several countries. You can access the site and see the global warming of your country, your province, and in some cases, your city, here.
Editor's note: This story has been updated with the most recent information about United Nations Conference of the Parties developments.
Thumbnail depicts Earth’s warming stripes from 1850-2020. (Professor Ed Hawkins/University of Reading. CC BY 4.0)