Summer of extremes: See who's had it best and worst so far
Meteorologist
Tuesday, July 7, 2015, 5:05 PM - June 2015 panned out very much as our Summer 2015 weather Forecast predicted.
The country, once again, was divided in half, with Western Canada experiencing well above normal temperatures and eastern Canada into the average to below average temperature range. Every major municipality from Saskatchewan west to B.C. experienced above normal temperatures ranging from 2ºC to 4ºC above normal. Temperatures in B.C. to end June were pushing and surpassing the 40ºC, mark breaking these very old records.
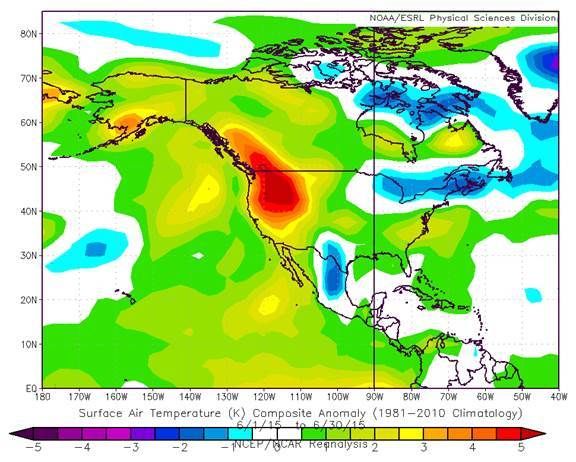
The opposite is true for cities from Ontario east to Atlantic Canada where temperature were 1ºC to 3ºC below normal. That didn’t mean that June was “cold” for many places but we were missing a lot of those hot, muggy days that we were used to in years past. Below is an image showing the temperature anomalies (how above or below normal the temperatures were) in North America for the month of June. What is evident is the very persistent ridge in the west bringing the hot, dry weather and the trough in the east bringing the cooler, unsettled weather.
Precipitation was the other big story in June: whether it was lack of precipitation or too much precipitation, we saw it all in Canada. Western Canada has been in a very dry period. Some parts of the B.C. interior have been receiving good amounts rainfall due to thunderstorms but the majority of western Canada has seen little to no rain in June. Many major cities in western Canada saw half or under half of their normal June rainfall. Vancouver only recorded 11 mm of rain in June where the monthly normal is 54 mm (that’s about 20% of their rain for June). No rain has been recorded so far in July for Vancouver (as of July 7). Below are two images from Agriculture and Agri-Food Canada displaying the precipitation of the “growing season” (April 1 – current, 2015) and comparing it to the historical distribution.
As you can see the majority of the B.C. coast is in “record dry” territory. The other image displays the same information but for the Prairies once again showing “extremely low” to “record dry” conditions. It is fairly evident why the wildfire situation in the west has been so dire with incredible smoke, evacuations and terrible air quality.
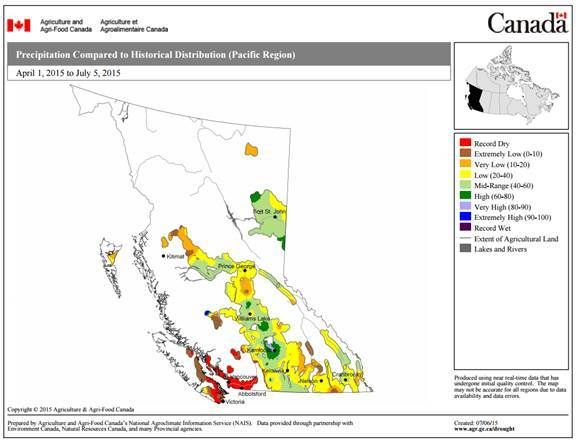
Precipitation in growing season compared to historical distribution for B.C. via Agriculture and Agri-Food Canada. Source.
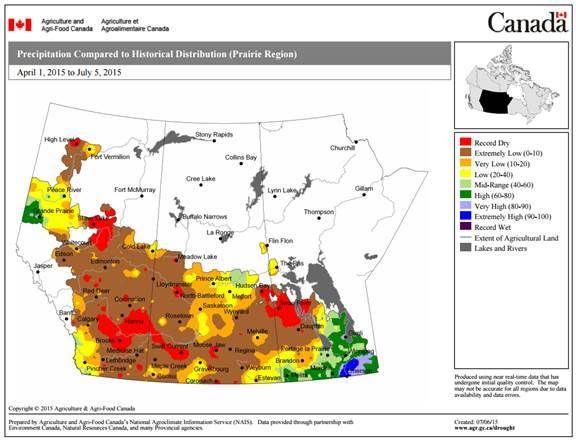
Precipitation in growing season compared to historical distribution for the Prairies via Agriculture and Agri-Food Canada. Source.
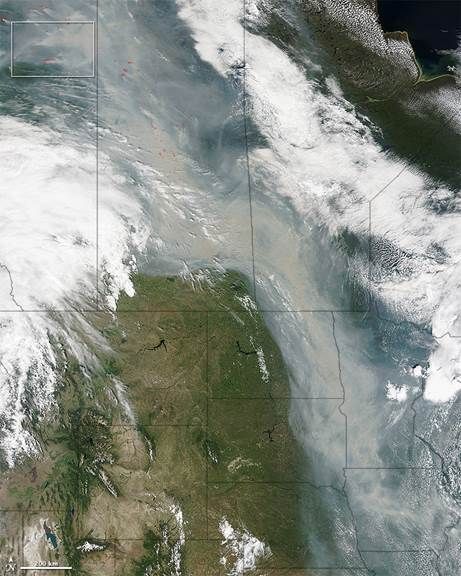
Image of smoke from Canadian wildfires spreading south across the United States. Image from June 29, 2015 via NASA.
The opposite was the case for many cities in eastern Canada. Toronto measured 160 mm of rain in June making it the third wettest year on record since records began at Toronto’s Pearson International Airport in the late 1930’s. 2010 is the wettest June on record for Toronto with 192 mm, 2000 in second with 169 mm. Toronto’s average rain for June is about 72 mm meaning Toronto received over 200% of its normal rainfall.
Montreal had a wet June as well with about 142 mm of rain with the monthly average being 87 mm (that’s about 160%). The Maritimes were also above normal for rain. Below are two images from Agriculture and Agri-Food Canada displaying the precipitation of the “growing season” (April 1 – current, 2015) and comparing it to the historical distribution. It’s quite evident that it was been wetter than normal from Ontario through to the Maritimes with some values in the “extremely high” range.
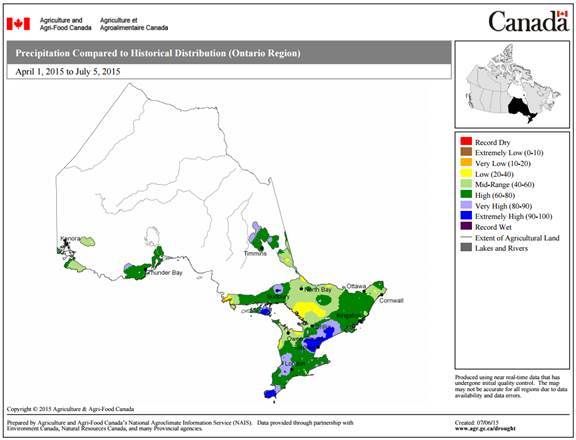
Precipitation in growing season compared to historical distribution for Ontario via Agriculture and Agri-Food Canada. Source.
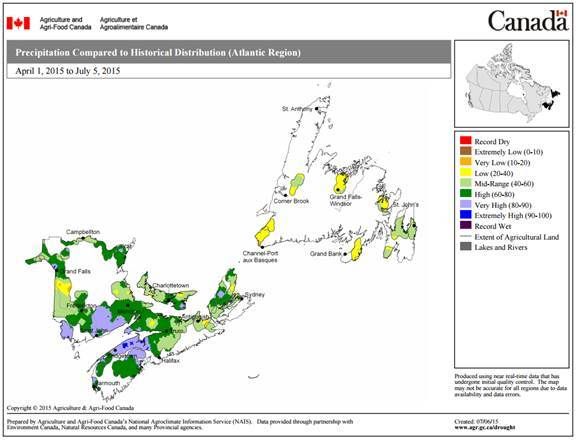
Precipitation in growing season compared to historical distribution for the Atlantic Provinces via Agriculture and Agri-Food Canada. Source.
Tune into The Weather Network on TV -- and visit theweathernetwork.com -- to find out how the rest of the summer pans out.