Intense polar vortex causes Canadian weather to grind to a halt

The polar vortex broke this weather chart and has made Canadian weather a tad boring.
Canadians in every province and territory have become increasingly familiar with the polar vortex ever since its fragments spilled into parts of Canada and caused a brutally cold winter during the 2015 North American cold wave.
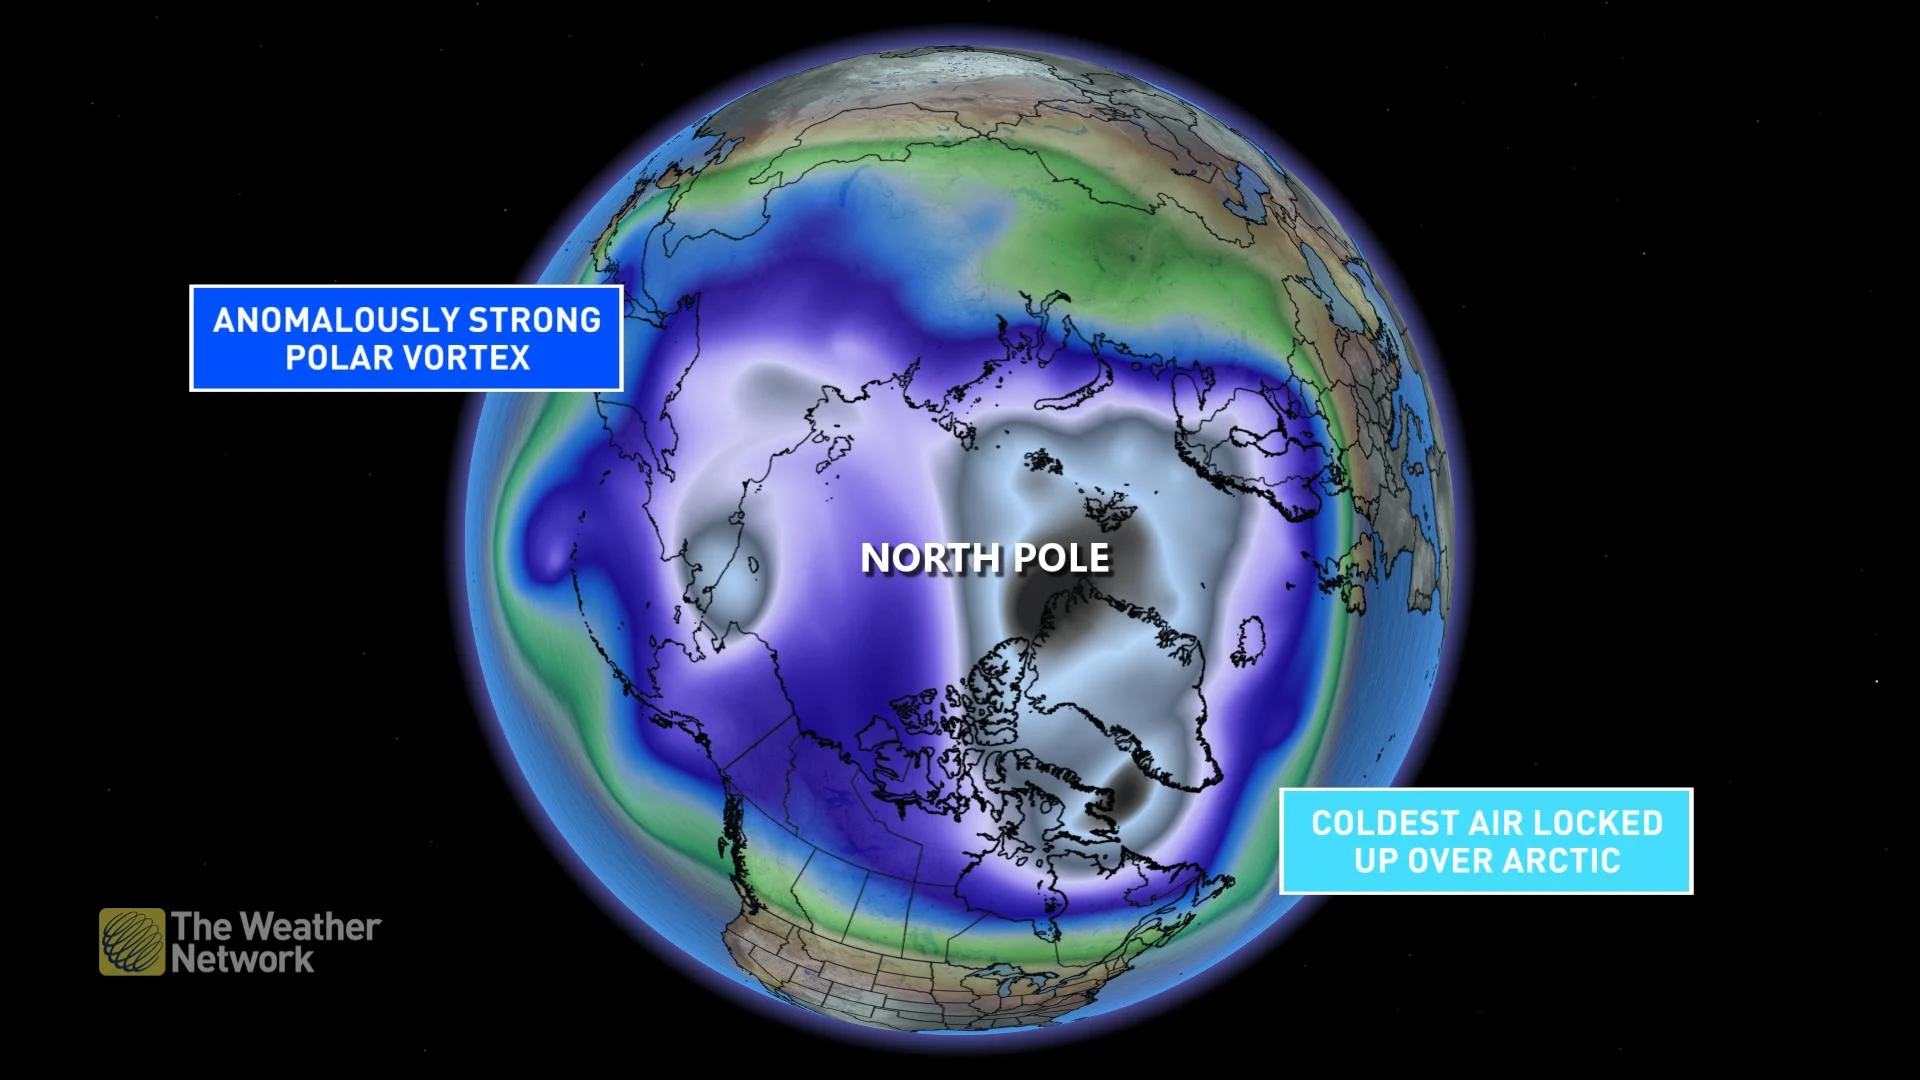
We have essentially seen the opposite behaviour from the polar vortex over these past few months as it has remained extremely well consolidated over the highest latitudes, which has consequently caused sea ice buildup at a faster rate than previous winters.
The jet stream has frequently oriented itself zonally this winter, flooding milder Pacific air across North America. The lack of jet stream amplification from north to south and the strong polar vortex locked up north has developed surface areas of low pressure closer to the Arctic Circle. This has had a profound impact on Canada’s winter weather and has thrown an important metric, the Arctic Oscillation, literally off the charts.
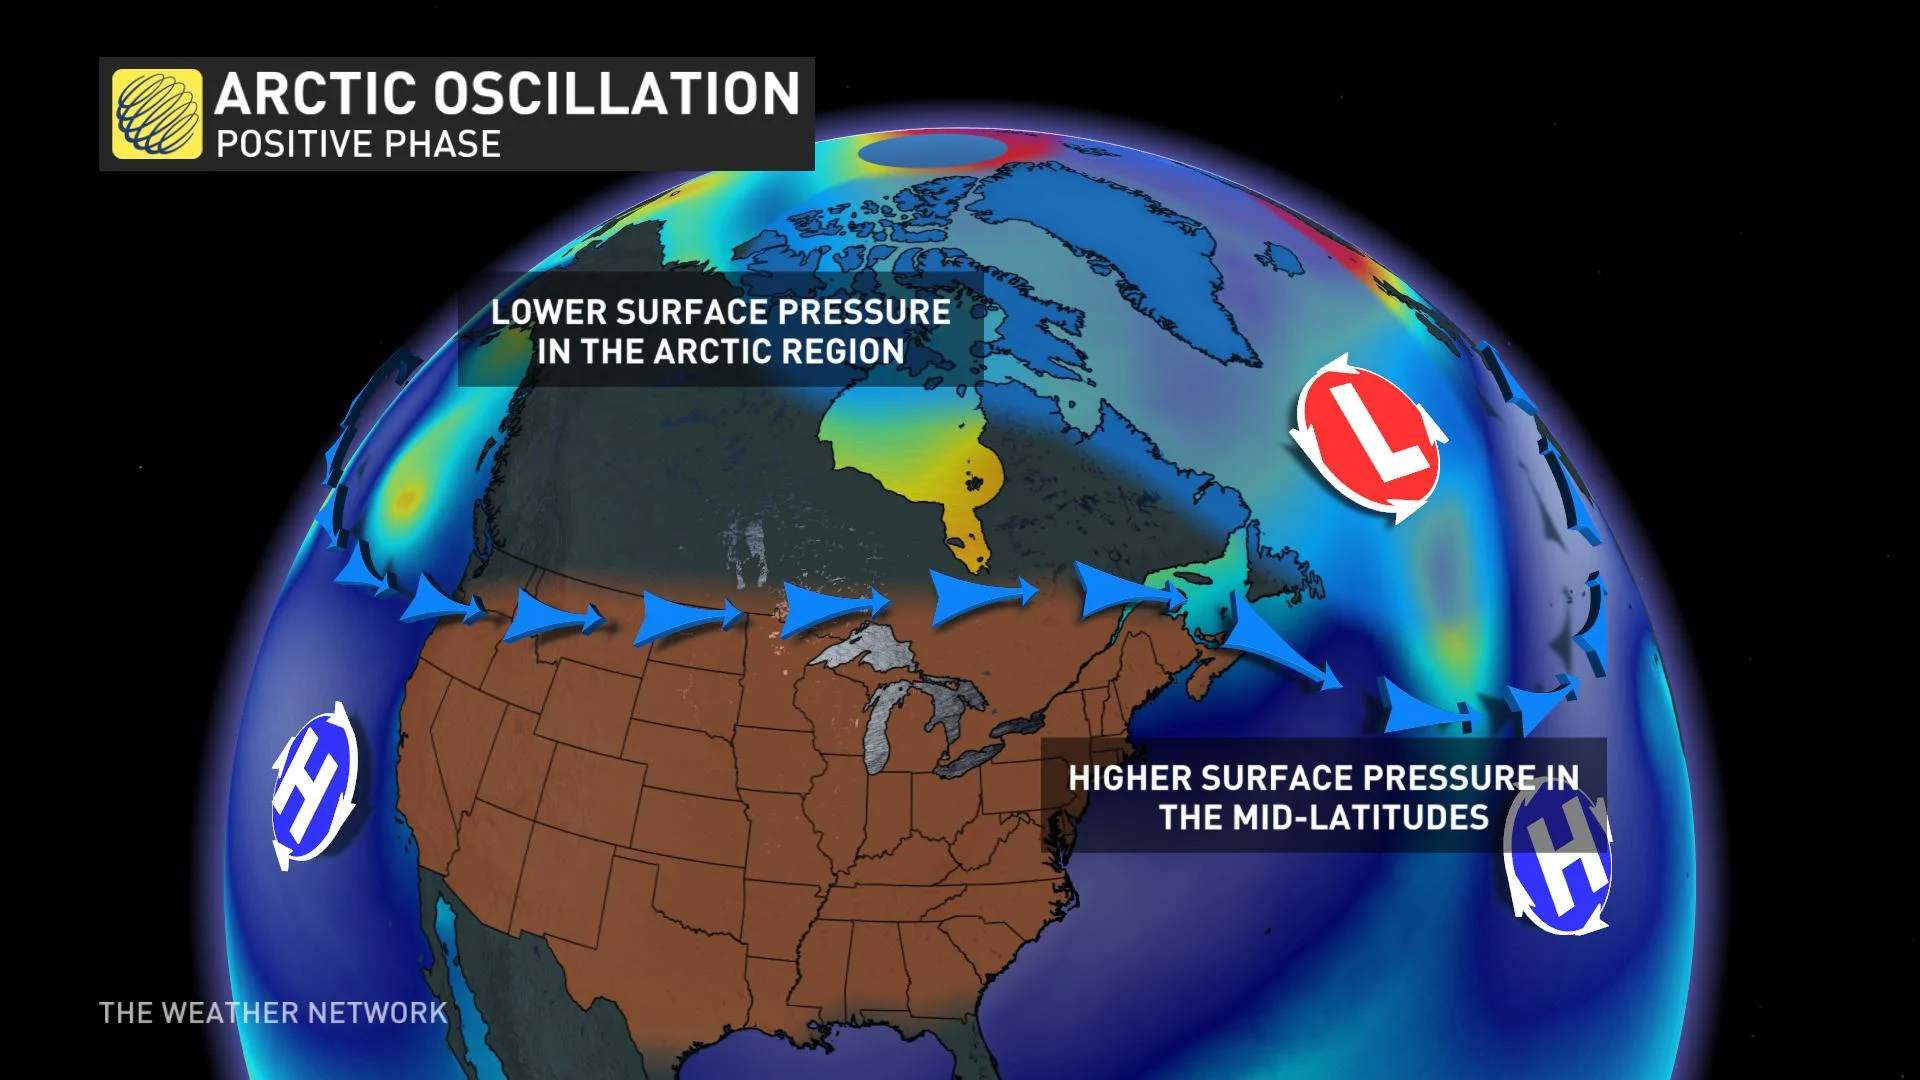
Arctic Oscillation (AO), as the name implies, is an oscillating atmospheric circulation over the higher latitudes in the northern hemisphere. When the AO is in a positive phase, a ring of strong winds circulates around the North Pole and keeps the cold air contained to this region, which is contrary to its behaviour in the negative phase when the circulating winds weaken and allow cold Arctic air masses to flow southward and bring unsettled weather to the mid-latitudes.
So far this year the AO has remained positive every single day. This causes lower pressure over the Arctic and higher pressure over parts of the Pacific and Atlantic Oceans.
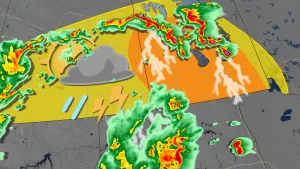
A positive AO, created the perfect recipe to develop strong storms across Newfoundland, developing a robust snowpack. The positive AO leading up to the Newfoundland blizzard allowed cold air to infiltrate Atlantic Canada, shifting the stormtrack eastward. This pattern intensifies low-pressure systems as they move past the Grand Banks of Newfoundland.
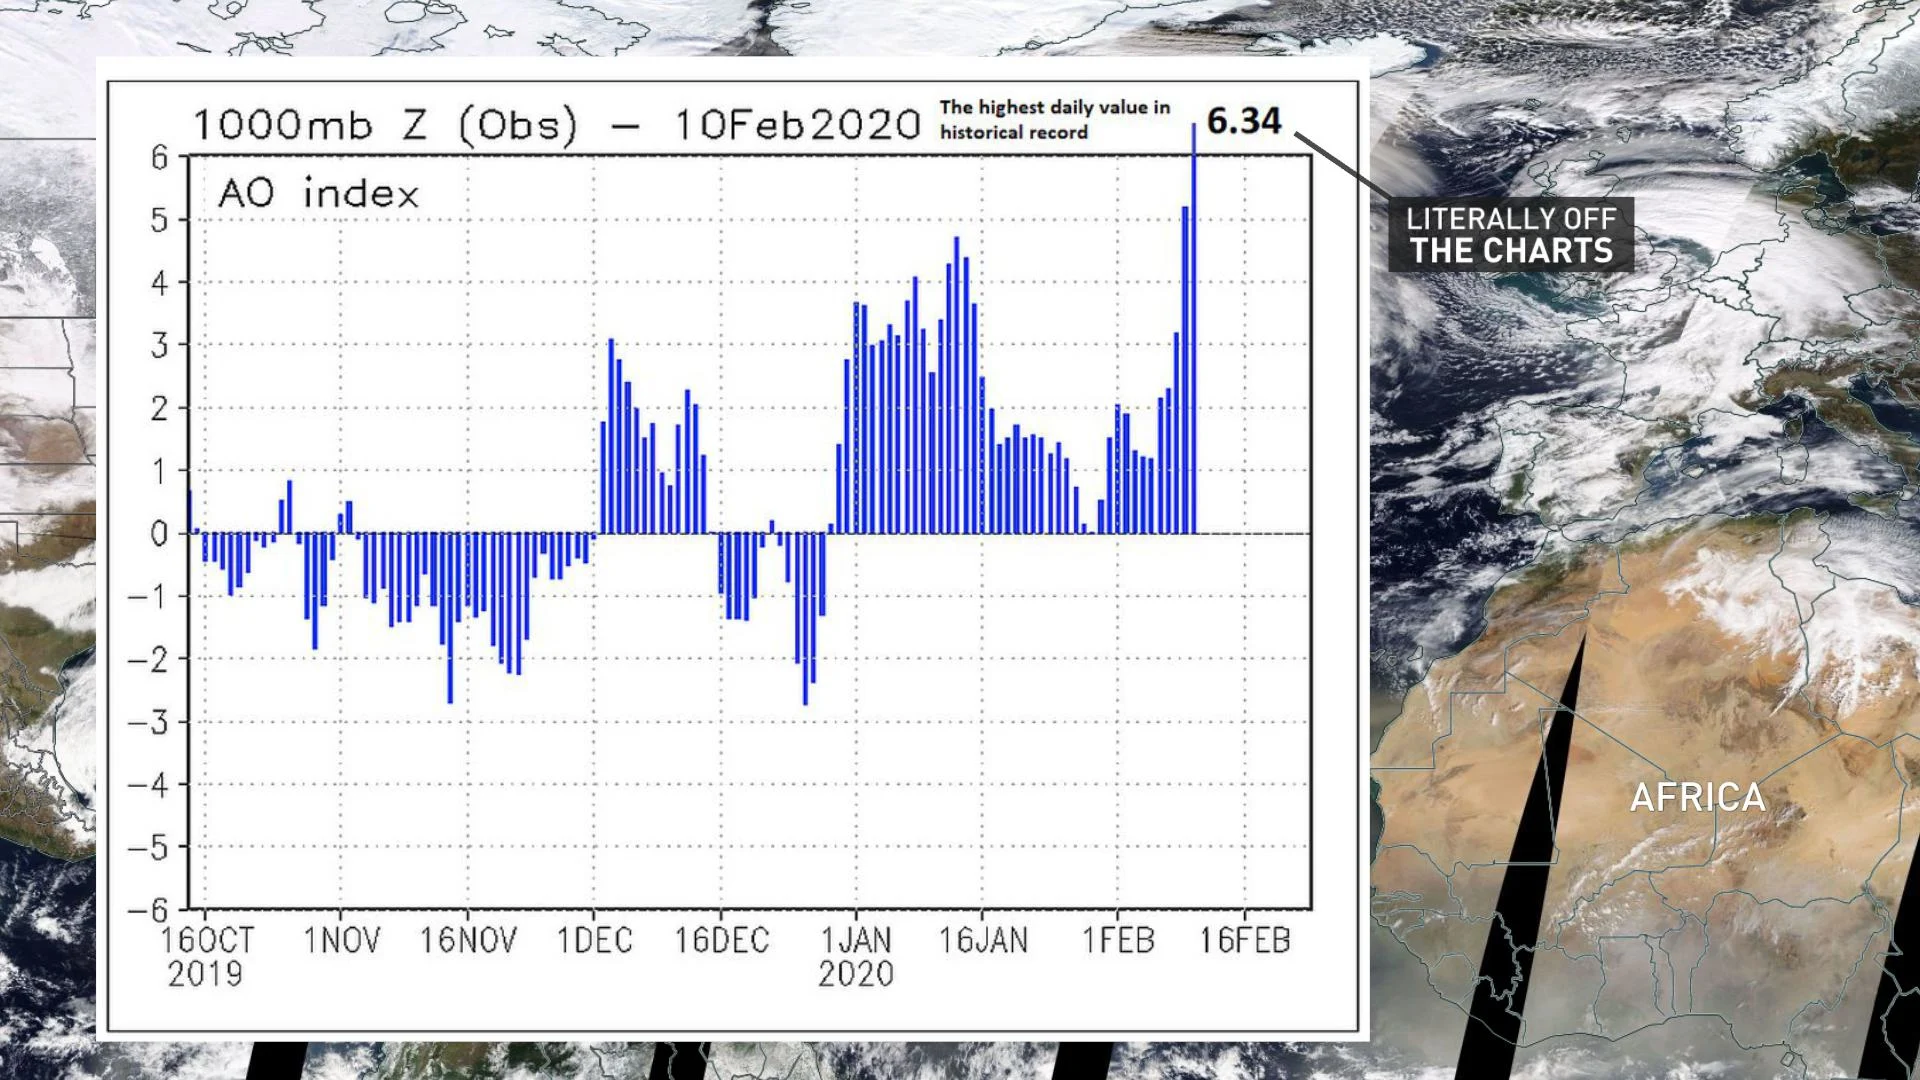
LITERALLY OFF THE CHARTS
One chart says it all. On February 10th the AO smashed the previous all-time record at 6.34.
Weird enough, but by February 22nd, the AO will likely break the brand-new record. For reference, the previous AO record topped out just under 6, back in February 1990. The current forecast shows a range of AO values, perhaps peaking as high as 6.5.
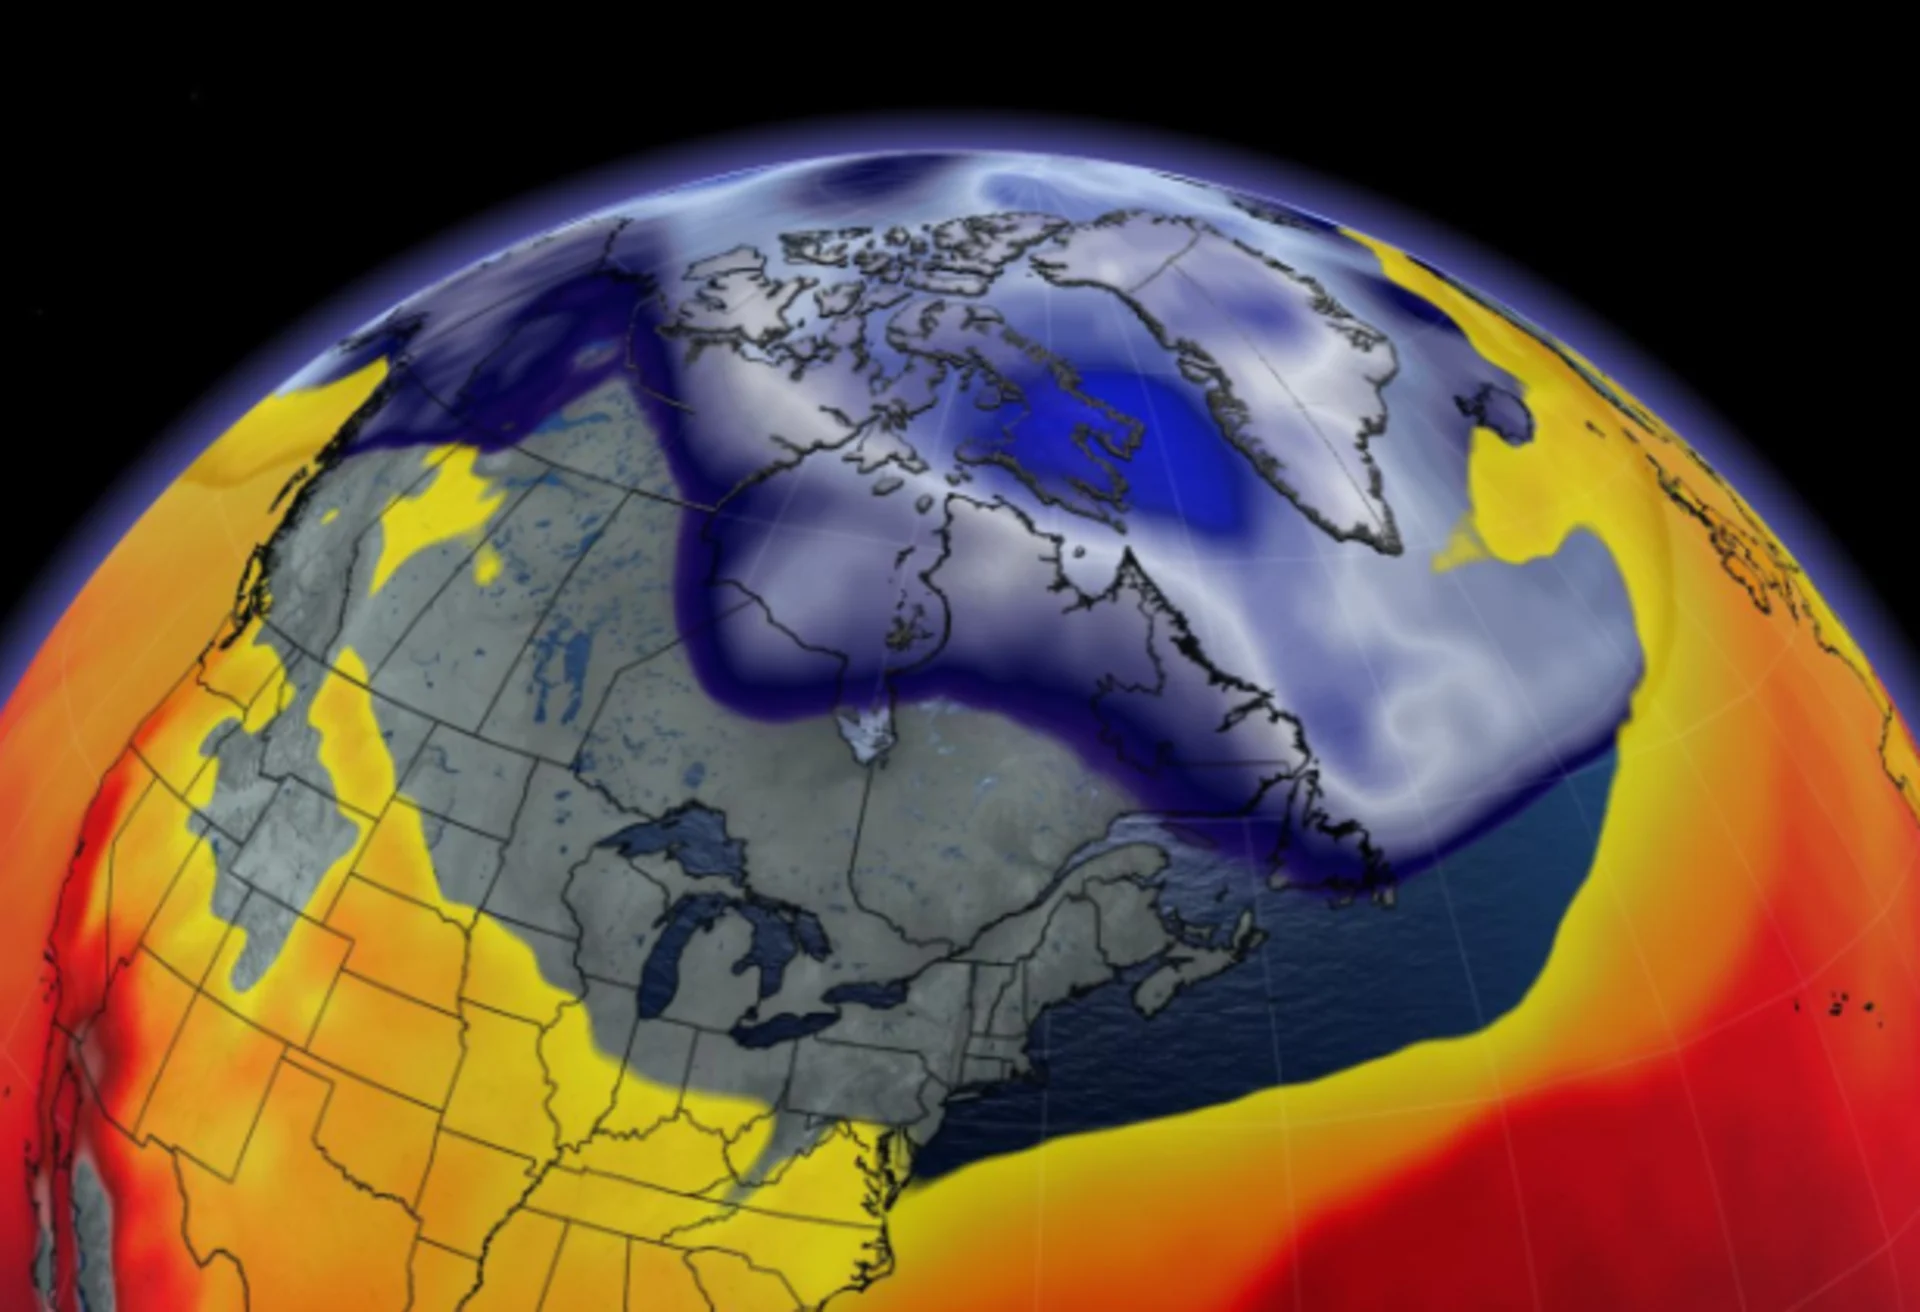
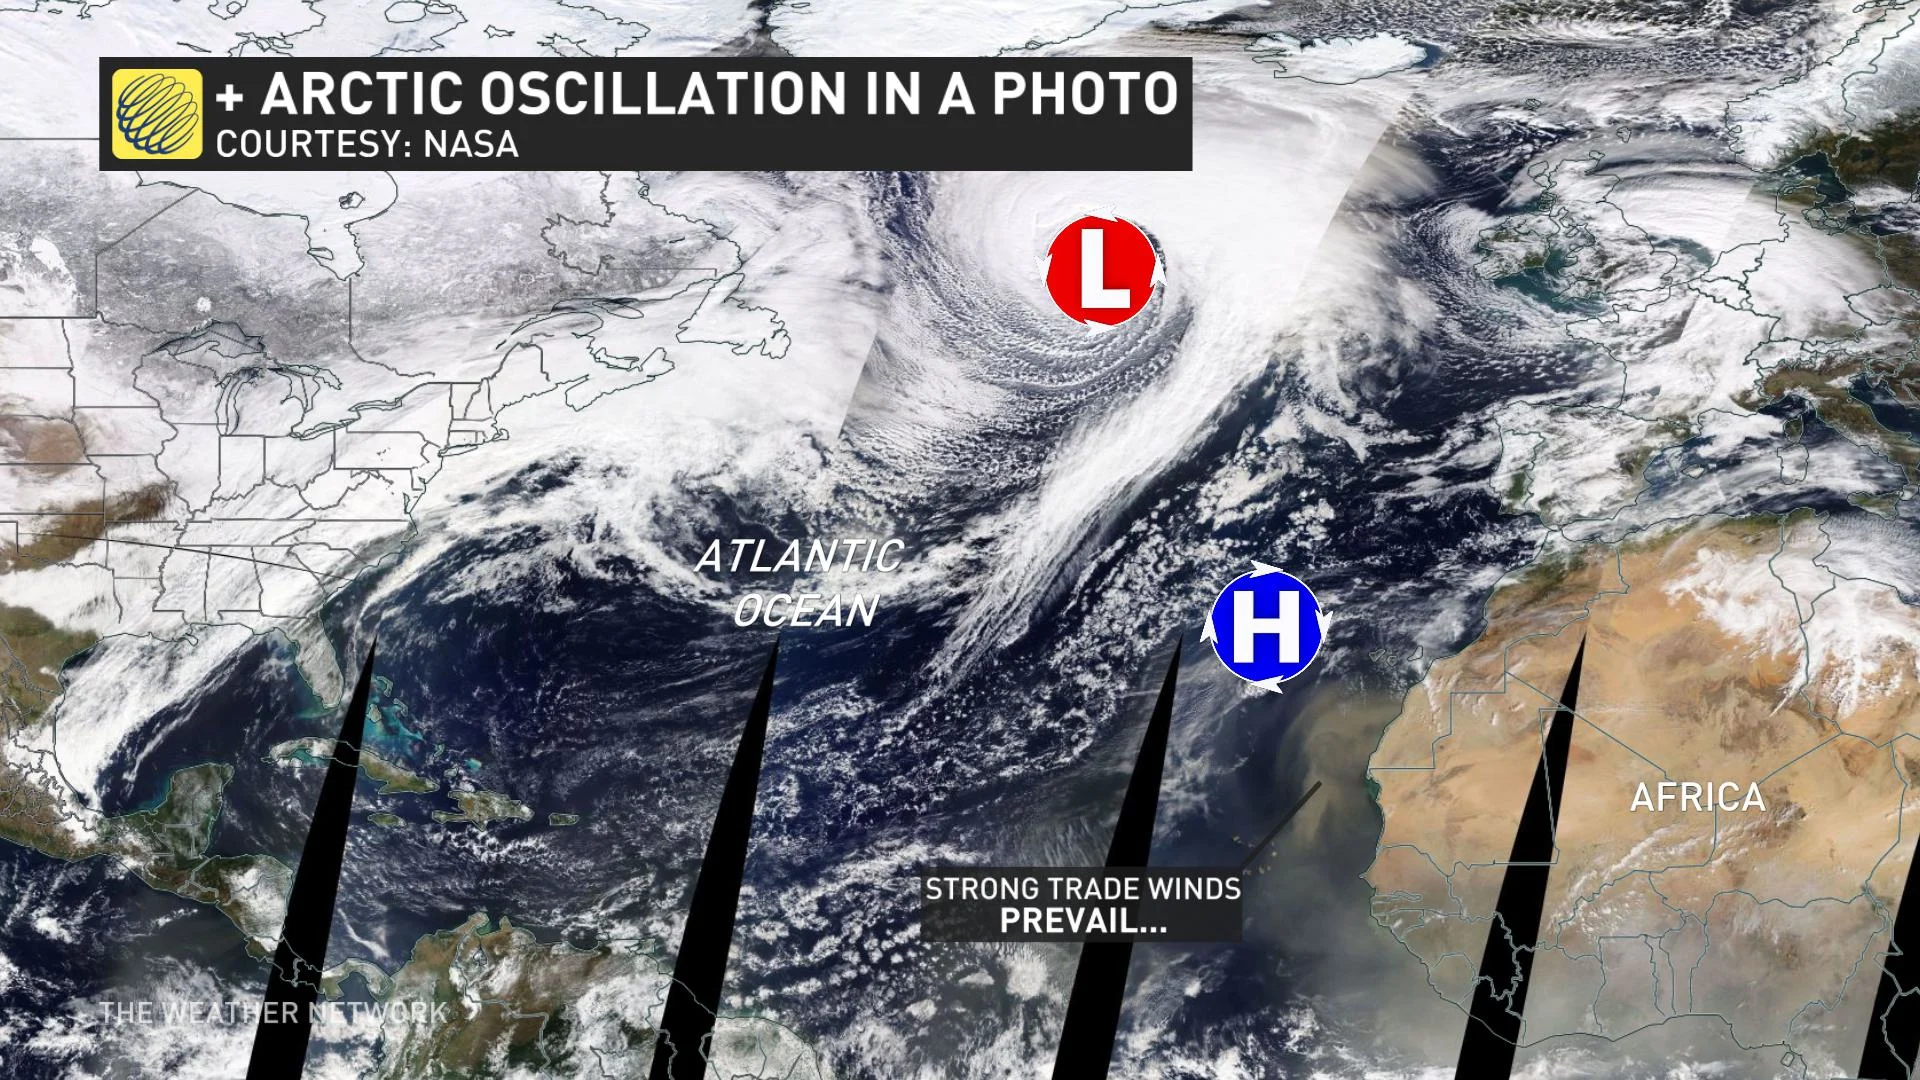
THE AO IN A PHOTO
Graphs are great, but let's visualize a positive AO from space.
A recent satellite photo by NASA illustrates the record-breaking positive AO. Powerful low-pressure systems are approaching 920 millibars at the higher latitudes and this paired with strong trade winds blowing the dust off the continent of Africa is a classic trait of a highly positive AO.
When will the current stretch of the positive AO phase end?
No end in sight. Not a single computer model highlights the possibility of the AO dipping into the negative phase for the remainder of February.
No nasty, long-duration cold outbreaks in sight, Canada.