The largest earthquakes ever recorded and the Pareto principle, explained

Mathematical patterns help scientists understand some of the most complex processes on Earth, including catastrophic earthquakes.
Over the past 120 years, a single tectonic event is responsible for over 20 per cent of the energy released from all the earthquakes that have occurred.
May 23rd marked the 60th anniversary of the Great Chilean earthquake, the largest earthquake ever recorded on the planet – by a longshot.
Such powerful forces of nature are complex phenomena that can be difficult to understand, but scientists are able to learn more about some of the most catastrophic earthquakes by applying mathematical theories and patterns.
The well documented Pareto principle, also known as the 80/20 rule, states that 80 per cent of the output from a given system is determined by just 20 per cent of the input.
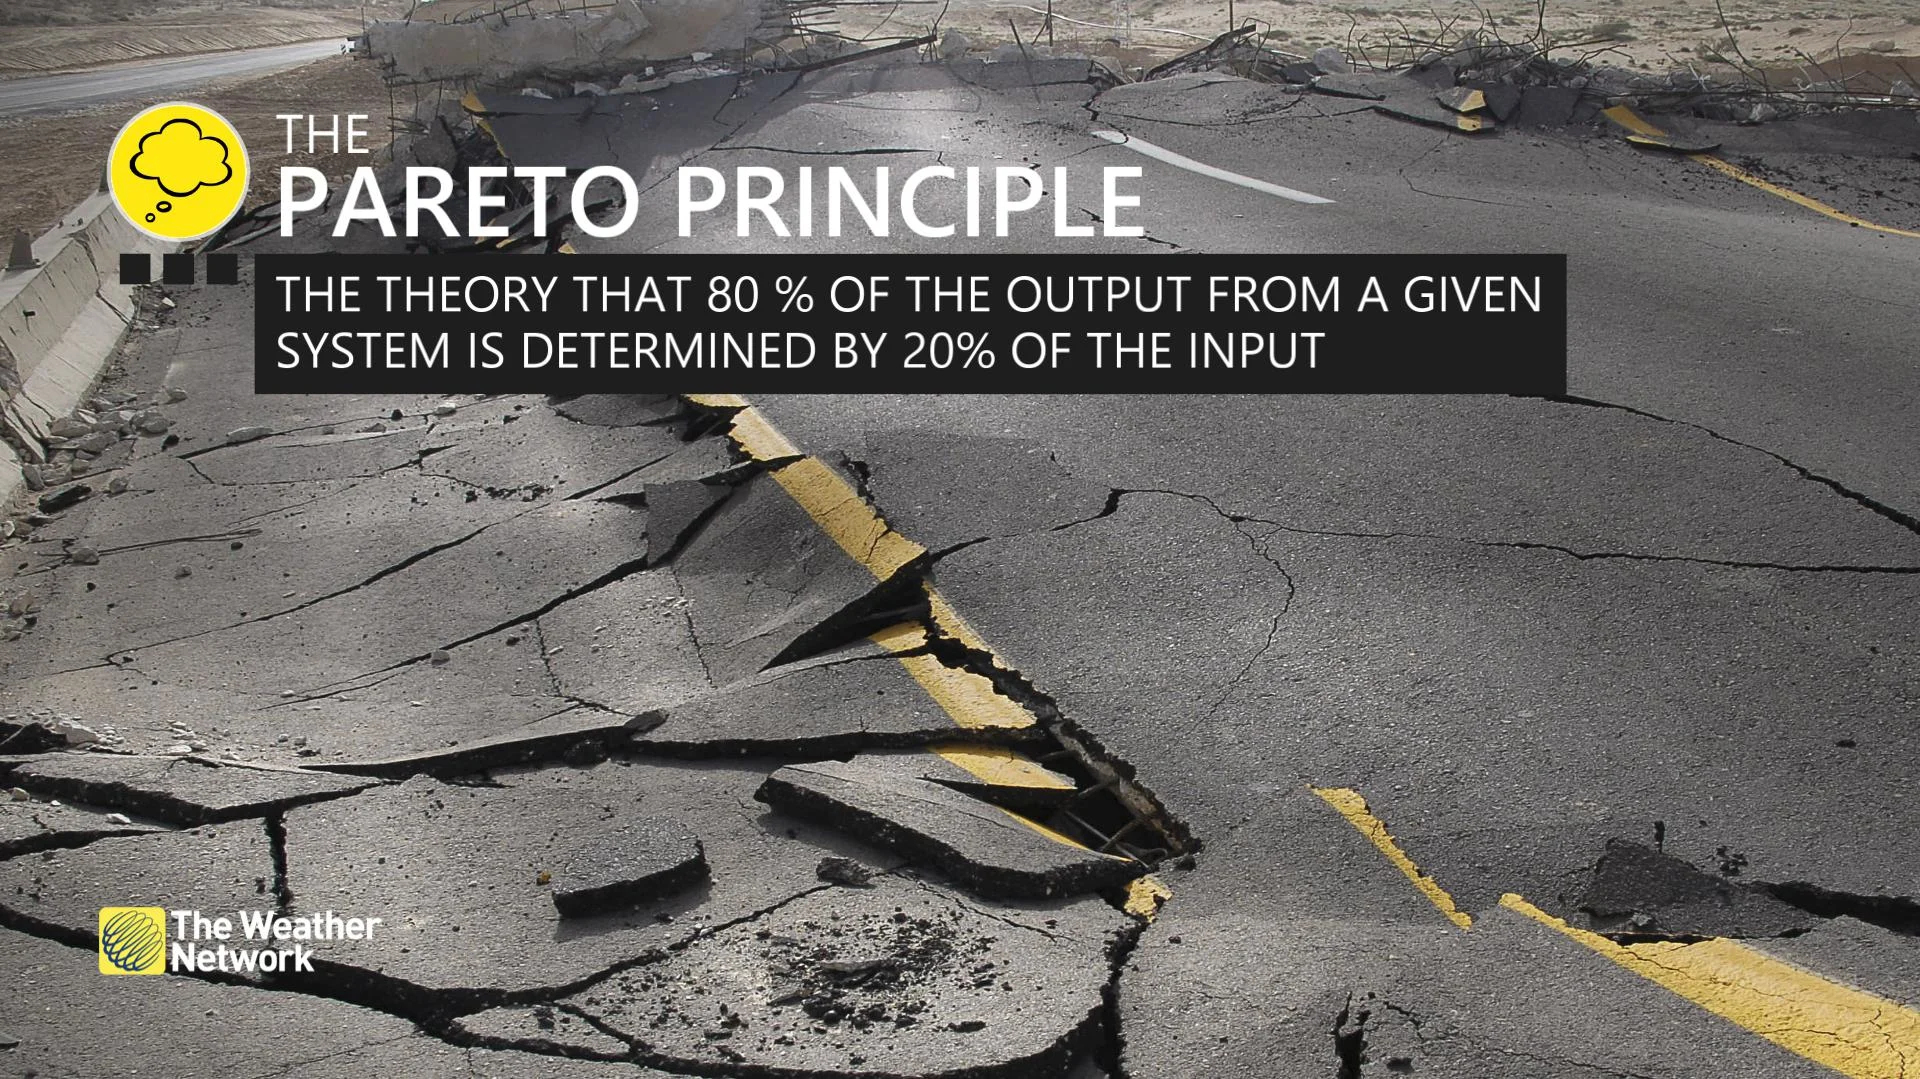
This pattern is captured in economics with wealth distribution and more recently with the spread of COVID-19. It should come as no surprise that natural phenomena, including earthquakes, can also follow this particular distribution.
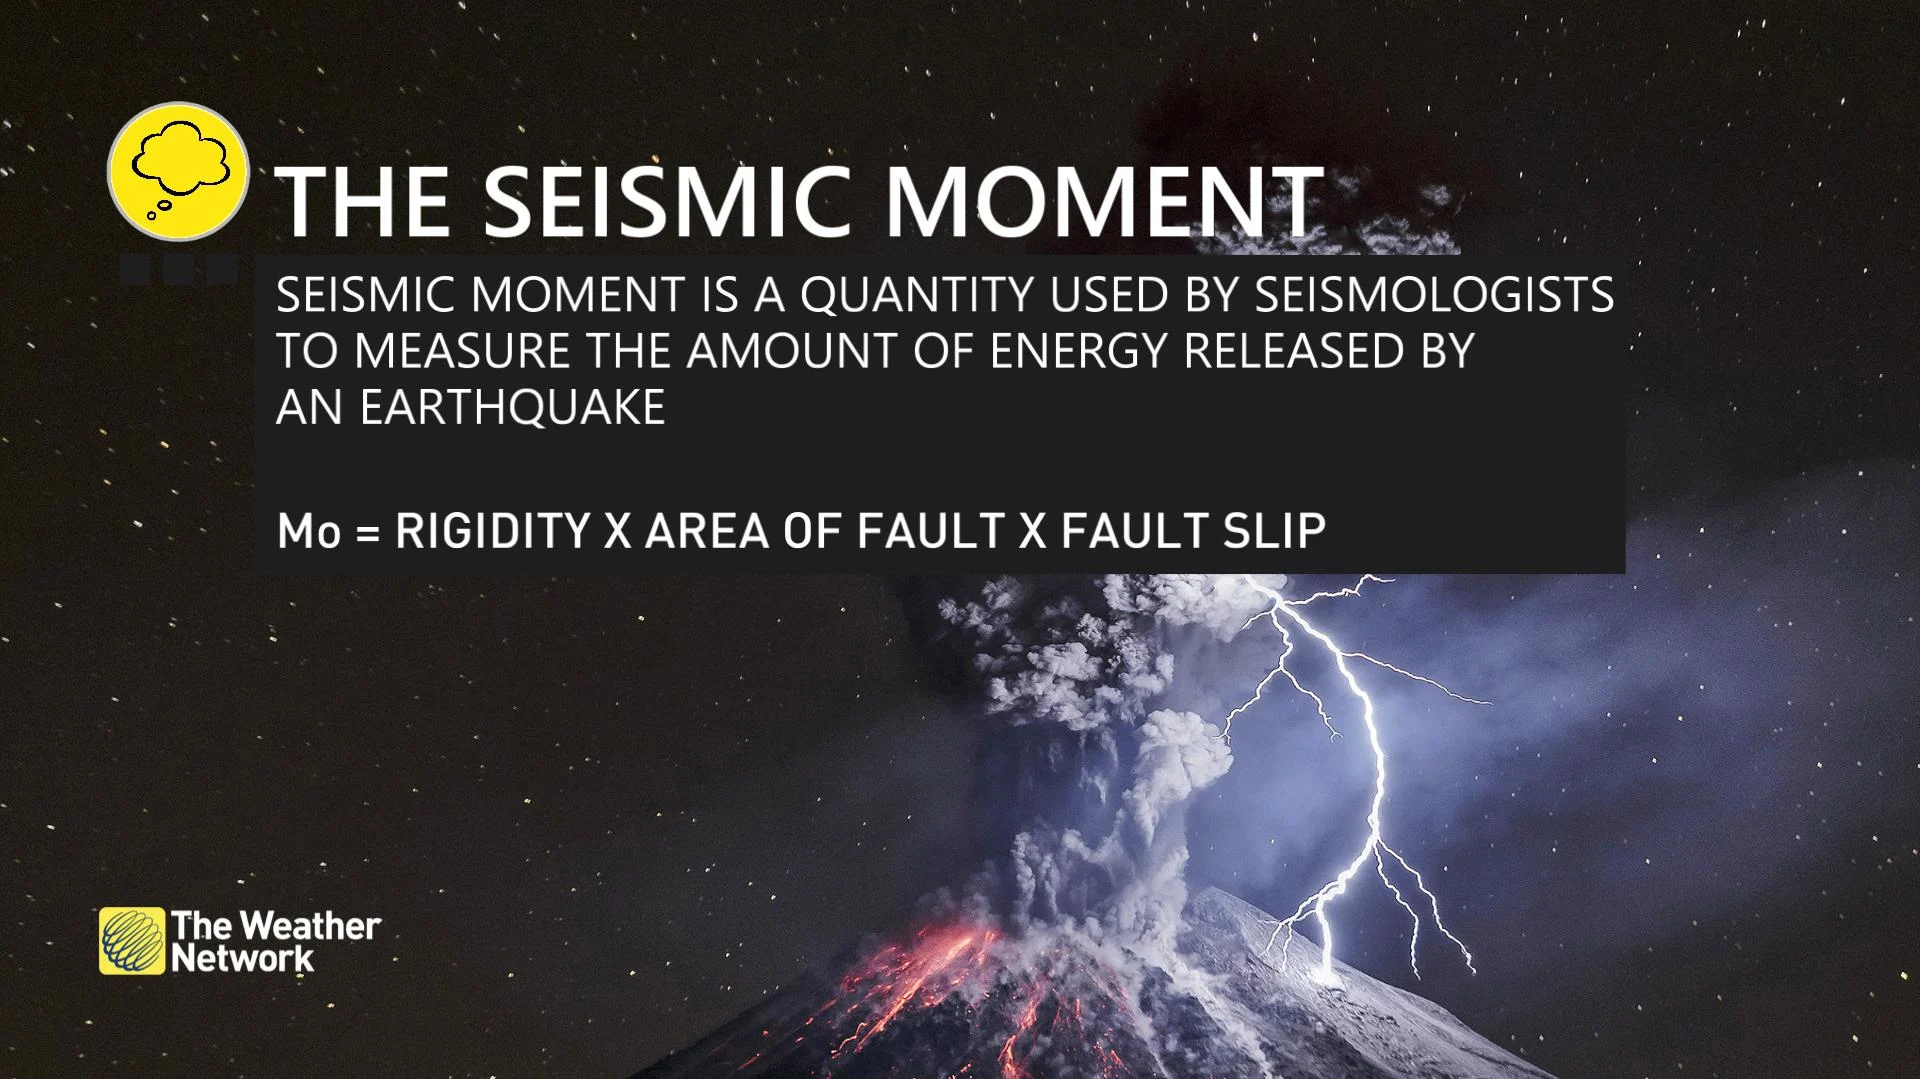
Almost all of the energy released from the Earth's crust comes from the seismic moments of the largest documented earthquakes. A seismic moment is the amount of energy released by earthquakes, taking these three main factors into account: rigidity, the area of the fault and the fault slip.
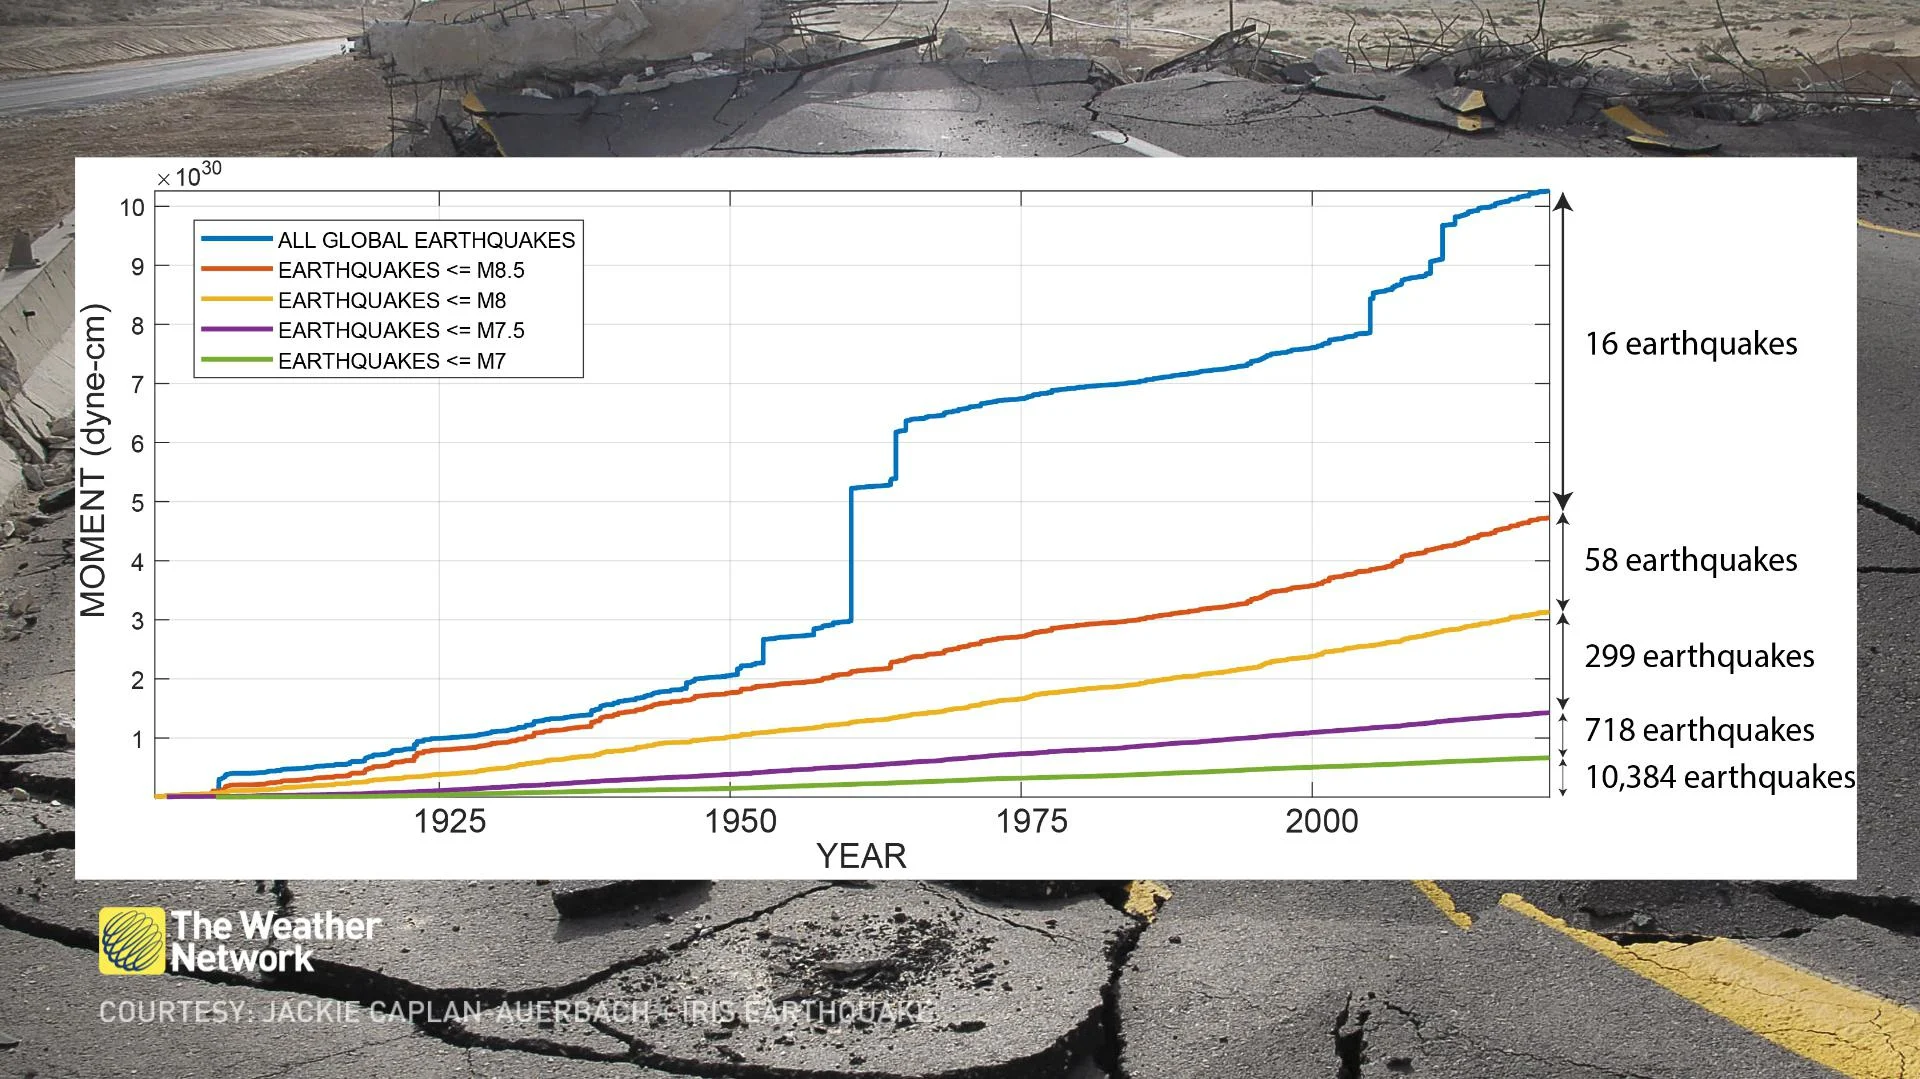
The graph below uses a logarithmic scale, which shows a vast array of values in a compact way. It's quite a necessity when dealing with earthquakes because, to put it simply, big earthquakes are really big.
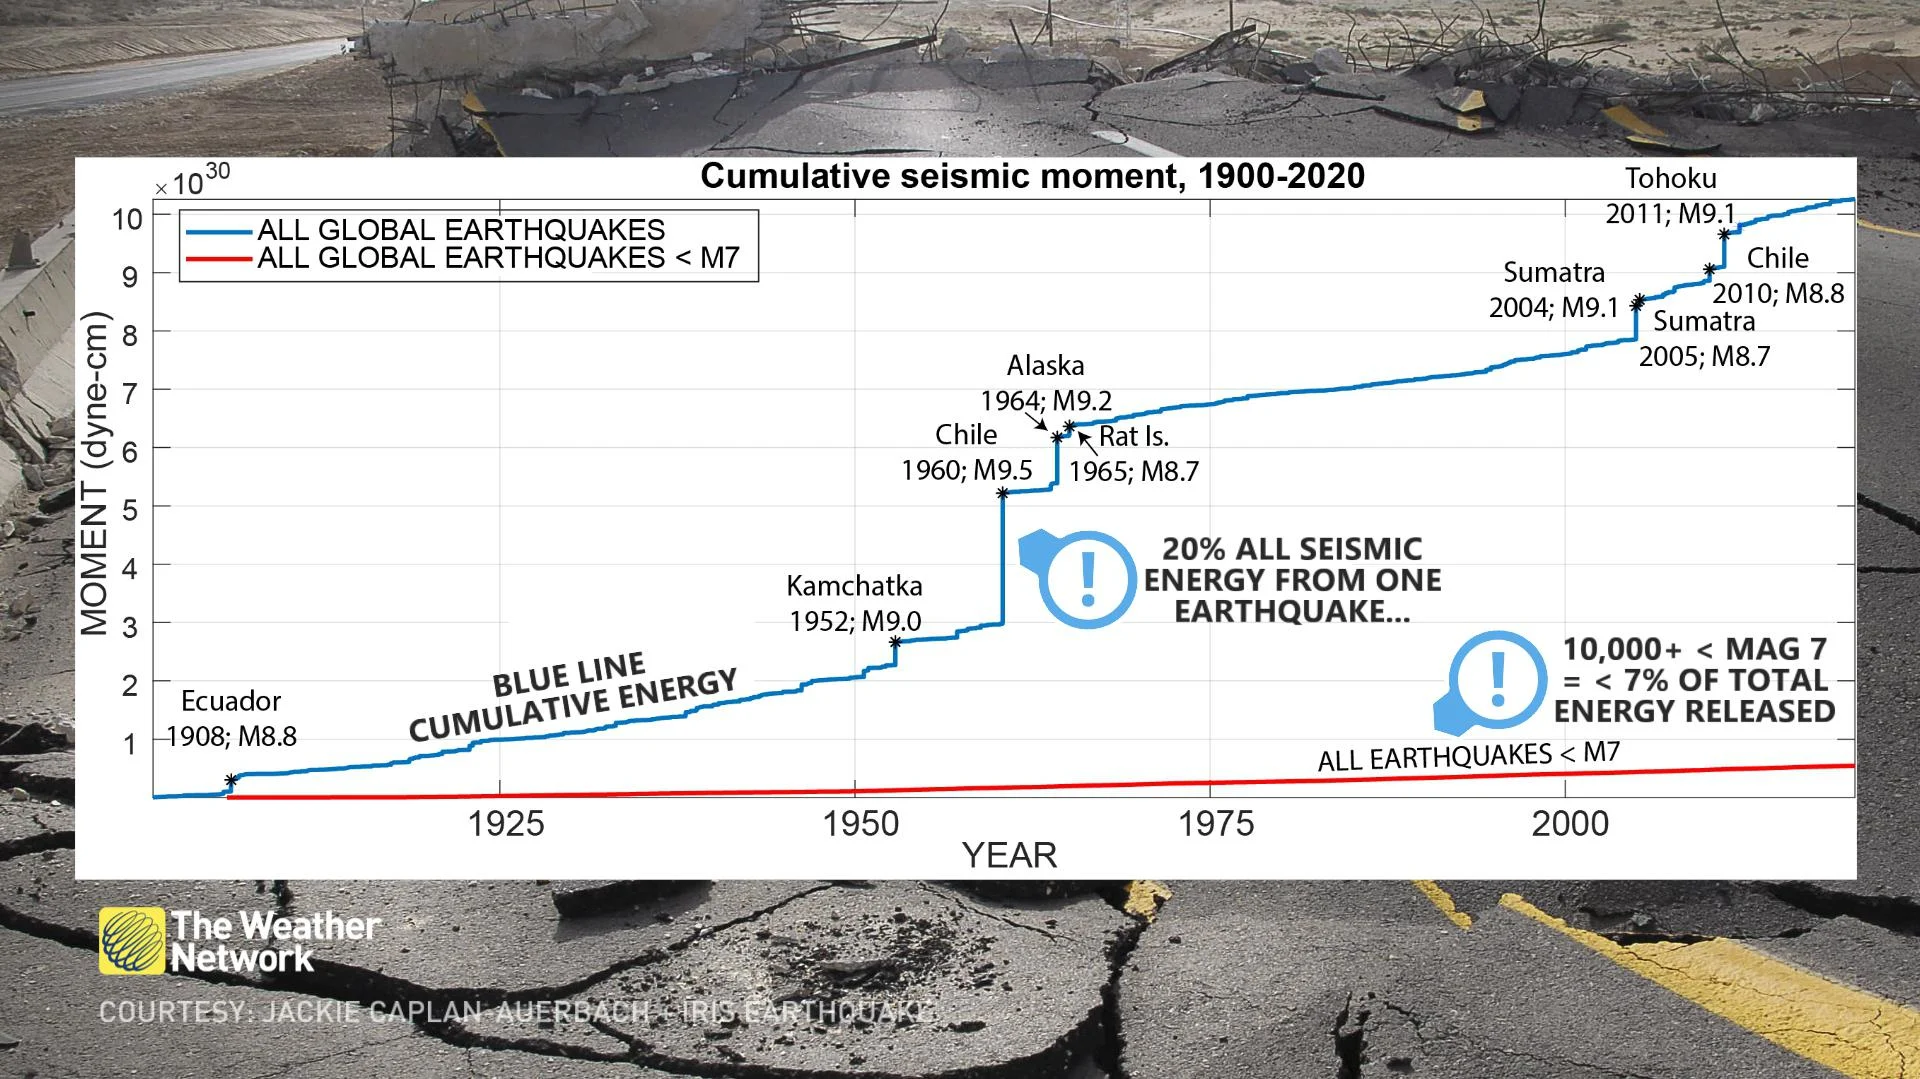
Draw your attention to the red line – over 10,000 earthquakes between magnitude 5.5 and magnitude 7 are included. This portion represents less than 7 per cent of the total amount of seismic energy over time and contributes very little to the total earthquake energy released over the past 120 years.
Perhaps you've heard about those 'small' quakes relieving the potential pressure of a megathrust earthquake. According to seismologist Jackie Caplan-Auerbach, 'it would take thousands of magnitude 6's and magnitude 7's to alleviate the stress released by a 9.'
The cumulative energy is tracked over time with the blue line, which is generally a smooth slope that gradually increases over time. On occasion, an abrupt vertical line highlights just how much energy a single earthquake can release.
If you're searching for Canada's largest earthquake in this period, you're out of luck. The 1949 Queen Charlotte Islands earthquake was a formidable magnitude 8.1, but it's completely washed out from the chart.
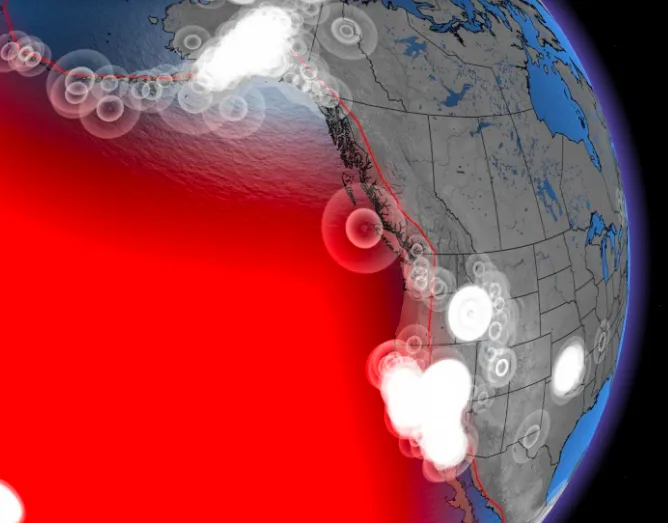
Roughly 80 per cent of the total energy released by earthquakes occur in subduction zone earthquakes, such as the magnitude 9 Cascadia Megathrust Earthquake of 1700 that struck in British Columbia.
The Pareto principle strikes again.