Antarctica is crumbling at its edges, says NASA scientist

Antarctica has lost far more ice than we once thought.
Combining decades' worth of satellite observations, NASA scientists revealed that climate change is robbing Antarctica of its ice even faster than previously thought, with twice as much having melted in recent decades.
Since the 1980s, NASA has collected data from several satellite missions, cataloguing the changes to Antarctica's floating ice shelves and inland glaciers. Each of these missions has revealed more about the impacts of climate change on that region of the world. However, two new studies pull all the data together to construct a more complete picture of the changes that have occurred over time.
"Antarctica is crumbling at its edges," stated Chad Greene, a scientist in the Ice and Sea Level research group at NASA's Jet Propulsion Laboratory (JPL). Greene is the lead author of one of the two new studies, in which he and his colleagues examine the calving of icebergs from Antarctica's floating ice shelves.
Their results, now published in Nature, found that since 1997 Antarctica's ice shelves have lost around 12 trillion metric tons of ice.
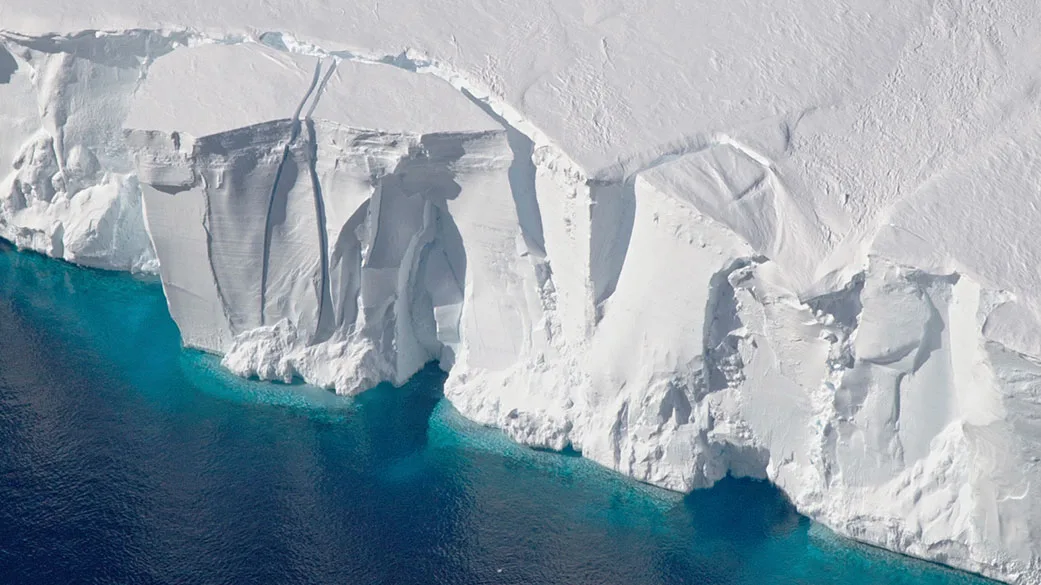
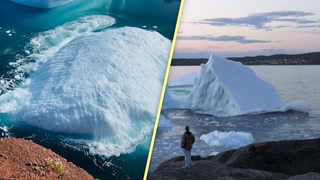
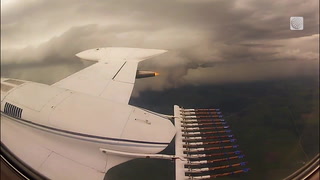
This photograph, taken during a 2016 flight of NASA’s Operation Ice Bridge, shows the leading edge of the Getz Ice Shelf in Antarctica where a section of the ice has cracked away from the rest. This section will eventually calve off to produce a new iceberg. (NASA/GSFC/OIB)
In their study, Greene and his colleagues examined satellite imagery taken in visible and infrared light, as well as radar altimeter data, over the past 25 years. While visual and infrared imagery provides views of the ice movement, radar altimetry data reveals how the ice has thinned. From this, they developed a map of the Antarctic coastline and the changes in the flow and calving of ice during that time.
Until now, it has been difficult to produce an accurate map of those changes. While altimetry data provides a clear picture of how ice thickness changes, examining visual and infrared imagery is challenging.
"For example, you can imagine looking at a satellite image and trying to figure out the difference between a white iceberg, white ice shelf, white sea ice, and even a white cloud. That's always been a difficult task," Greene explained in the NASA press release. "But we now have enough data from multiple satellite sensors to see a clear picture of how Antarctica's coastline has evolved in recent years."
The new estimate of ice loss found by this study is double the previous estimate, of 6 trillion metric tons, for that same time period.
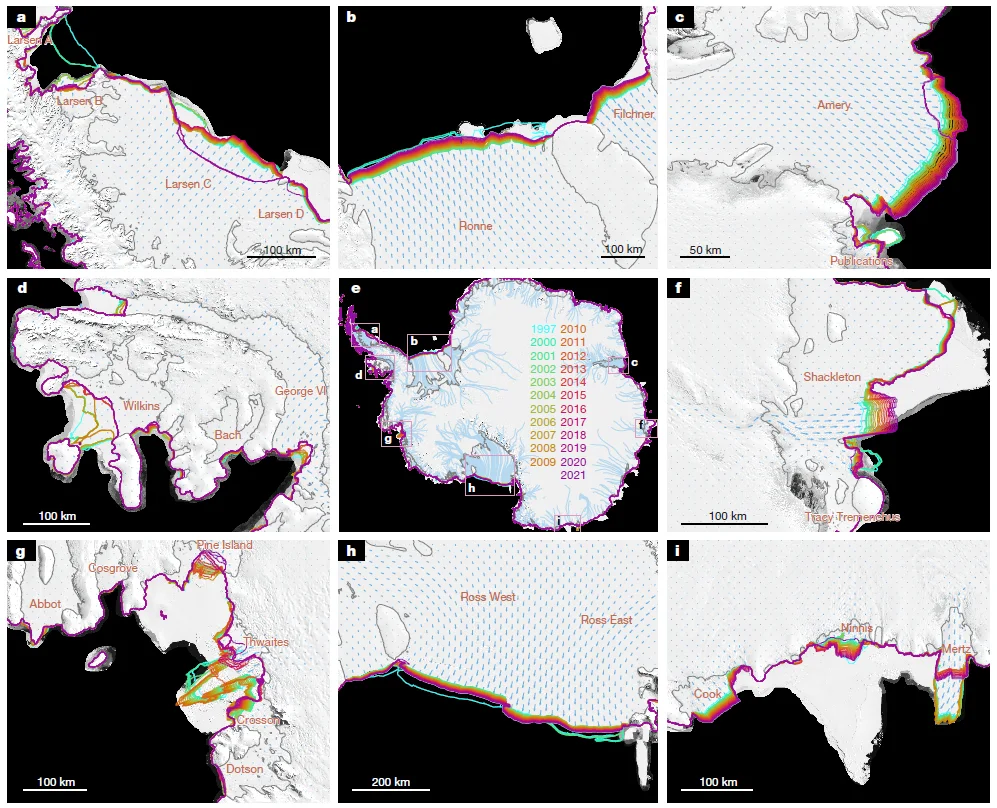
These maps reveal the retreat of Antarctica’s ice shelves over the past 25 years. (Nature/Greene, et al. 2022)
An ice shelf forms when glacial ice, pulled downward by gravity, flows downslope to the coast and then pushes out over the water. The result is a floating extension of the glacier, still attached to the ice on land, which can measure up to a few kilometres thick and hundreds of kilometres wide.
According to NASA, "Ice shelves act like buttresses to glaciers, keeping the ice from simply sliding into the ocean. When ice shelves are stable, they have a natural cycle of calving and replenishment that keeps their size fairly constant over the long term."
"And when ice shelves dwindle and weaken," Greene added, "the continent's massive glaciers tend to speed up and increase the rate of global sea level rise."
Calving events vary in size. Most produce single icebergs, some of which can have an area of a few thousand square kilometres. However, a few significant events have resulted in the collapse of an entire ice shelf.
While glaciers and ice shelves are replenished by snowfall, this process cannot keep up with the rate of ice loss due to calving in recent decades. The researchers say that so much ice has been lost from Antarctica's ice shelves that there's no way for it to recover before the next major calving event — something they say will likely happen sometime in the next decade.
Inland Impacts
The impacts of climate change on Antarctica are not limited to just its coastline, though.
Another group of scientists at JPL examined the thinning of the Antarctic ice sheets by combining nearly 3 billion radar and laser altimeter data points, gathered by seven different satellites, into the longest continuous record of elevation changes across the region.
Their study was published this week in Earth System Science Data.
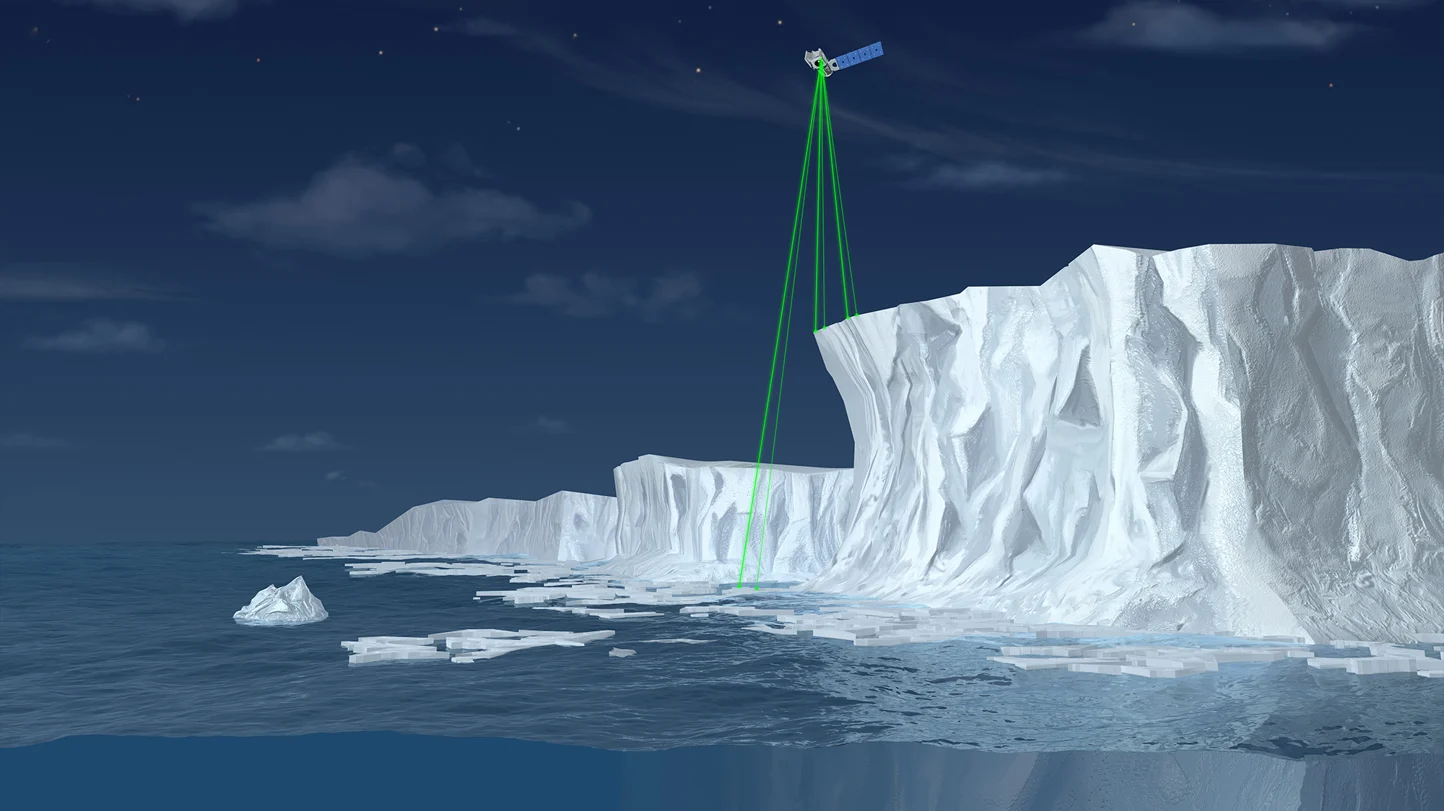
This artist's rendition shows ICESat-2's laser altimeter reading the elevation of an ice shelf and the ocean water next to it. (NASA's Scientific Visualization Studio)
Satellite altimeters bounce radio waves or lasers off the Earth's surface and then read how long it takes to detect the reflected light. The timing of the return signal gives the satellite a precise measurement of the elevation of the surface.
As these satellites fly over Antarctica, they read changes in the ice thickness down to the centimetre. This provides a precise picture of how the ice is thinning or accumulating in different parts of the continent.
According to NASA, "The unparalleled detail in the new record reveals how long-term trends and annual weather patterns affect the ice. It even shows the rise and fall of the ice sheet as subglacial lakes regularly fill and empty miles below the surface."
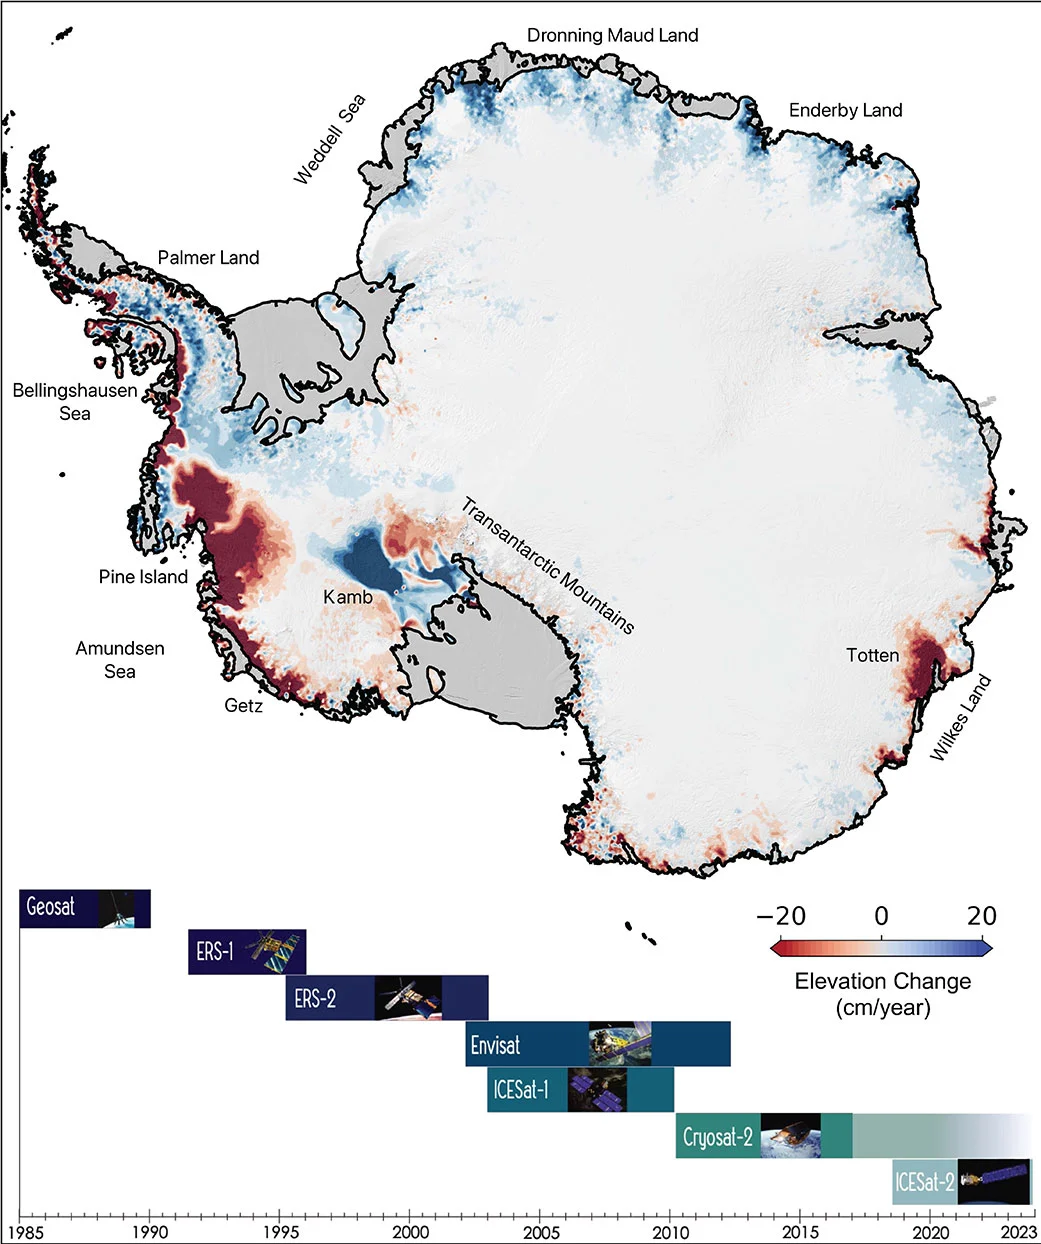
This map shows changes in elevation of the Antarctic ice sheet from 1985 to 2021. Areas where the ice has thinned over that time is shown in red, while regions where accumulation exceeds melting is shown in blue. The grey regions are the major Ice shelves that line the continent’s coasts. The timeline of satellite missions that supplied data are listed at the bottom. (NASA/JPL-Caltech)
In their study, the researchers found that between 1992 and the late 2000s, there was a balance across the Antarctic ice sheet. Any losses in ice thickness in West Antarctica were roughly equalled by gains in thickness in East Antarctica.
"In the later parts of the 2000s accelerated [West Antarctic Ice Sheet] losses outpaced [East Antarctic Ice Sheet] gains, leading to significant net decrease in ice sheet volume," they wrote. "This accelerated loss has been attributed to increased ocean melting and changes in precipitation."
"The western parts of Antarctica have seen both consistent and accelerated mass loss over the entire altimetry record dominated by the glacier systems of Pine Island and Thwaites," they added.
Johan Nilsson, the JPL scientist who led this second study, says that the combination of the subtle changes detected by their analysis and the long-term trends in the data set will help researchers better understand what influences ice loss. This, in turn, will lead to improved estimates of sea level rise.