
Advanced technology is powering next-level weather forecasts

Plenty has changed with The Weather Network over the past 30 years, but perhaps more than anything, are the changes in the technology we use to forecast the weather.
Weather forecasting is complicated.
It takes years of study to understand the science behind the weather - the dynamic motion of the atmosphere, the interplay between temperature and humidity, and how all of it adds up to produce an immense storm system that can deliver a deluge of rainfall or bury a region in snowfall.
The basic science hasn't changed all that much over the years. What has changed, however, are the tools and technologies meteorologists use in tracking weather, diagnosing severe weather, developing the forecast, and communicating the risks to the public.
DETECTING WEATHER - RADAR
Before we can forecast the weather, we need to see it - not just our own weather, going on above our heads, but all of it, and how it all relates together.
Radar is one of the indispensable technologies we use to sense the weather, and it has come a long way since 1989.
Thirty years ago, Canada had 18 weather radar stations across the nation.
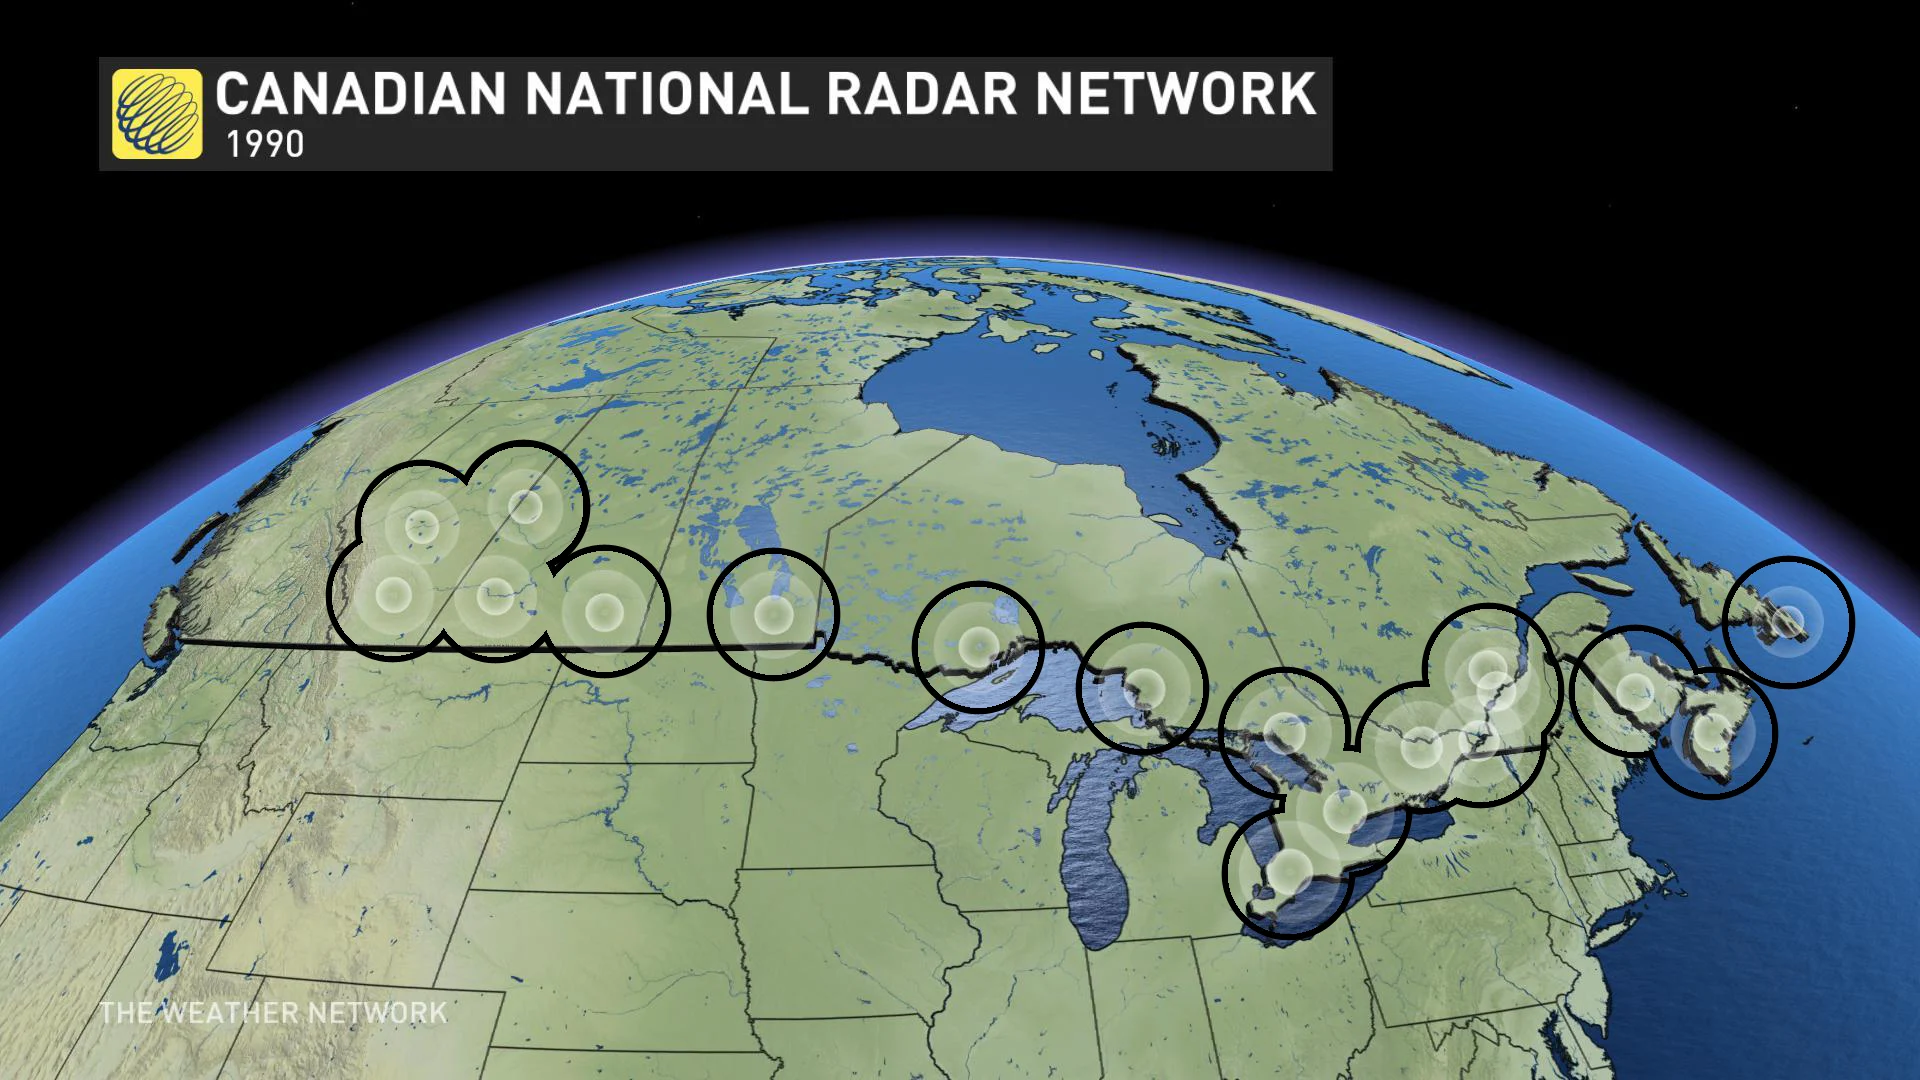
There were obvious gaps in coverage (especially in British Columbia), as most of these stations were specifically used for spotting local severe weather. Also, the technology used was only the most basic, showing only the intensity and extent of precipitation. Newer technology, like Doppler radar, was only just getting started.
How has radar technology advanced in 30 years? Dr David Sills tells all
Doppler radar has become essential for severe weather forecasting, due to its ability to provide forecasters with information about how precipitation is moving inside a storm. Being able to see this small-scale movement, along with the more obvious movement of the storm between sweeps of the radar beam, helps forecasters track potential tornadoes, as well as spotting wind shear conditions, and the potential for freezing rain.
In the years since, Canada's radar system has become a true network, reaching from coast to coast with a total of 31 stations, and capable of tracking storm systems across multiple scanning fields. Additionally, all stations are now equipped to scan with Doppler radar.

Technological advancements in radar technology have gone even farther now, with new 'dual polarization' scans can actually provide forecasters with information about what kind of 'hydrometeors' are falling - raindrops, snowflakes, snow or ice pellets, or hailstones.
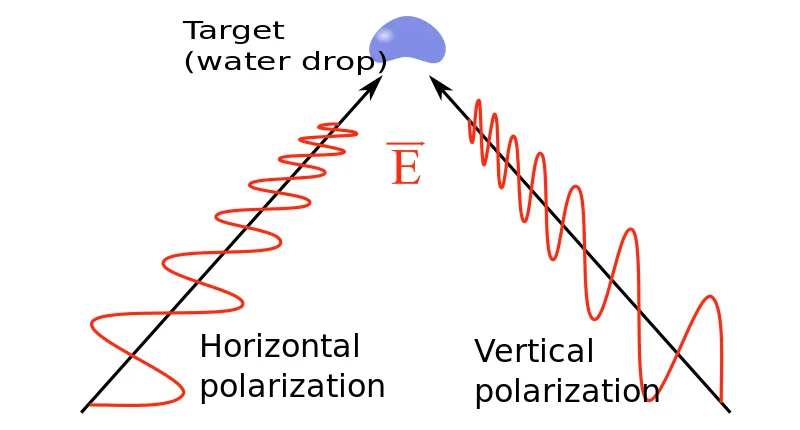
The combination of horizontally-polarized radio waves with vertically-polarized waves gives insight into the shape of the hydrometeor (raindrop) since the horizontal beam returns a stronger signal than the vertical beam. Spherical hail would show more uniform returns from both beams. Credit: Pierre cb/Wikimedia (CC BY-SA 2.5)
By scanning a hydrometeor's width and height, they can see how large the raindrops are (since they flatten out into lenses as they grow), the size of snowflakes, and whether ice pellets or hail are falling or circulating within the clouds (since they are more spherical).
DETECTING WEATHER - SATELLITES
Satellite technology has advanced in leaps and bounds since the late '80s.
Dr David Sills reveals the remarkable advancements in weather satellite technology
In 1989, the most advanced weather imagery from space was provided by the Geostationary Operational Environmental Satellite 7, or 'GOES-7'. It was capable of sending a full-disk image of the western hemisphere, in both visible and infrared, once every 30 minutes, and its high-resolution visible images showed us the Earth at a scale of around 1 square kilometre per pixel.
Hurricane Andrew, from 1992, imaged by GOES-7's VISSR visible and infrared atmospheric sounder (VAS) instrument. Credit: NOAA
Through the '90s and '00s, newer satellites first added the ability to gather more data, at an initial cost of a slightly longer wait between receiving images, and then increased the scanning speed until we were getting full disk images of Earth, every 15 minutes.
This was state-of-the-art for geostationary weather satellites, at least over North and South America, until the new 4th generation GOES-16 and GOES-17 satellites took over in 2017 and 2018.
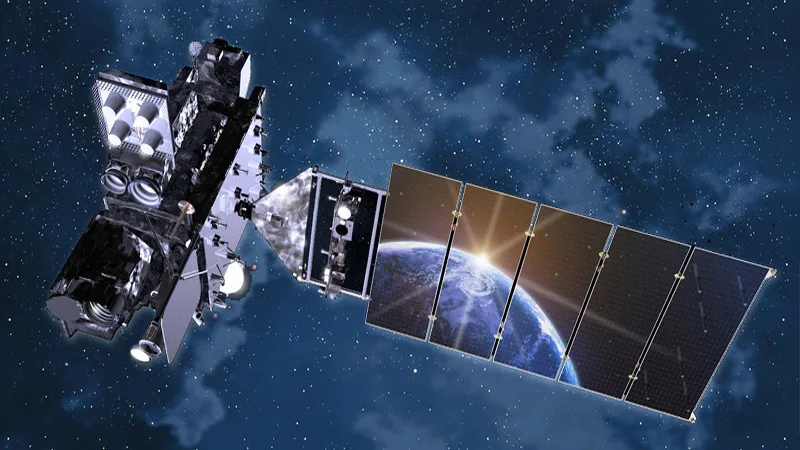
This artist rendition of a latest 4th generation GOES satellite shows it keeping watch over Earth's weather. Credit: NASA/Lockheed Martin
Each of these twin satellites now snaps images with a resolution four times better than what older satellites were capable of. This brings our weather into even sharper focus, allowing us to see details vital for severe weather forecasting. Additionally, the instruments gather so much information about weather and storms, across different temperatures and wavelengths of light, that forecasters can start to pick apart storms in a way that was really only science fiction before.
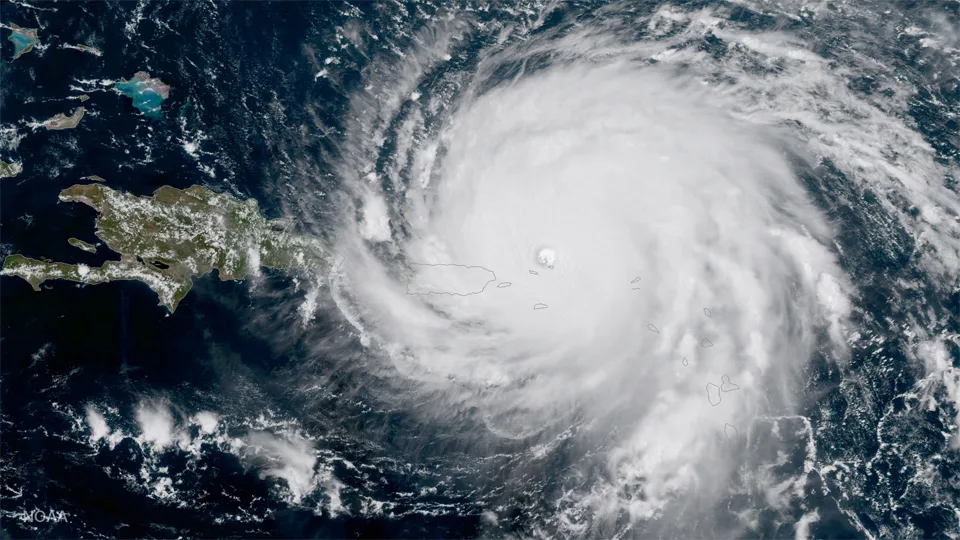
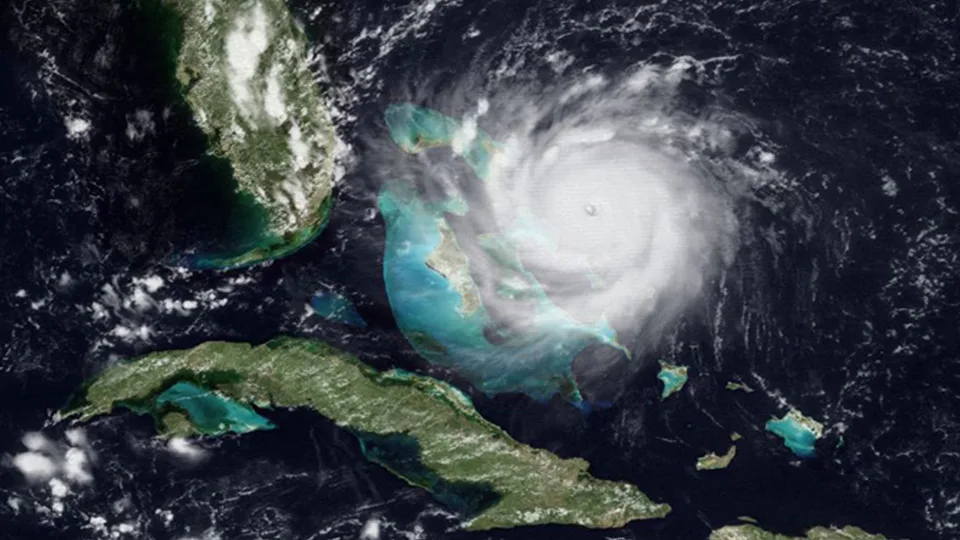
This GOES-16 image of 2017's Hurricane Irma shows roughly the same size field of view as the GOES-7 image of Hurricane Andrew, above, just shifted more to the southeast. The image reveals the greater detail and resolution of the Advanced Baseline Imager over older technologies. Credit: NOAA
Perhaps most remarkably, GOES-16 and GOES-17 can do all of this, providing a complete look at the weather over the western hemisphere, in a way unheard of before, every 10 minutes. Plus, if severe weather threatens, they can even zoom in to focus on where that weather is occurring, and produce a stream of images, taken every 30 seconds.
WEATHER MODELLING AND FORECASTING
Any weather forecast is a blend of a forecaster's personal knowledge and experience, and a healthy amount of guidance from computer generated weather models. When using computers to generate weather model forecasts, the result you get comes down to a tug of war between time and detail, moderated by computer power.
In the past 30 years, computer power has skyrocketed!
Back in 1989, the most powerful supercomputer was the Cray Y-MP. It took up a small office on its own, seated four with room to spare, and was capable of performing around 2.4 billion operations per second.
As powerful as that was then, in 2019, anyone with a modern smartphone holds hundreds of times that computing power in the palm of their hand. Some phones can perform around 700 billion operations per second or more.
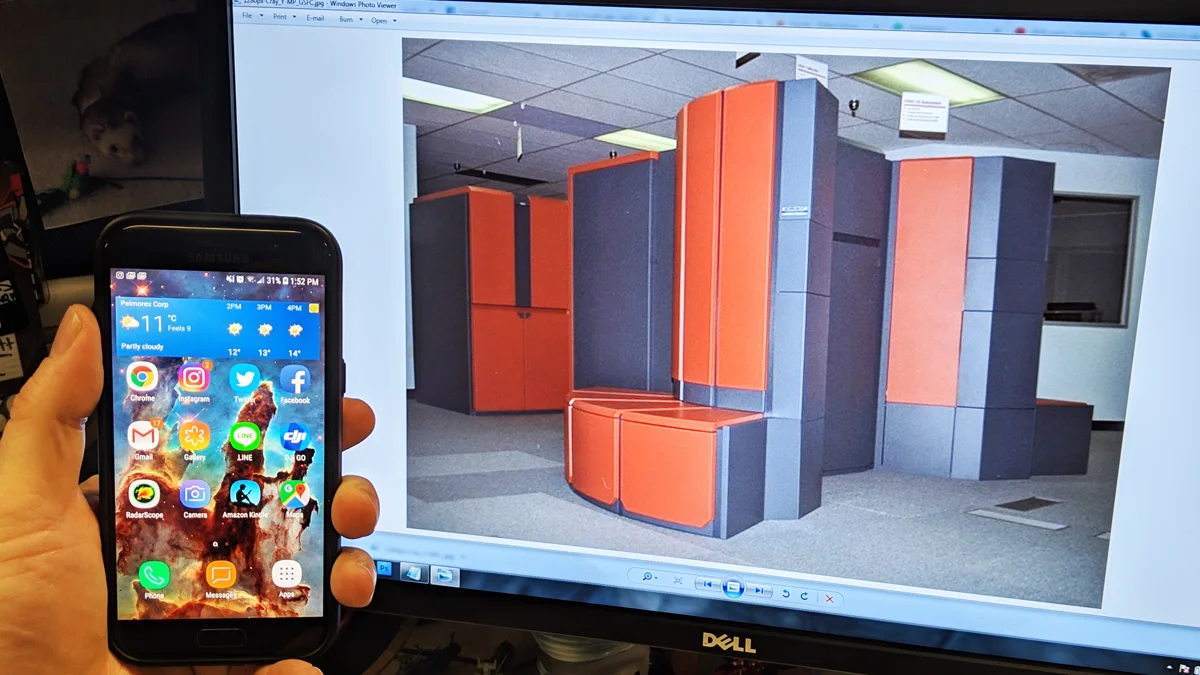
This Samsung Galaxy A5 cellphone has more computing power than the most powerful Cray supercomputer from 1989. Photo by James Stamoulakatos
The supercomputers running today's weather models are now millions of times more powerful than the Cray Y-MP. As of 2016, the U.S. National Weather Service runs their weather models on supercomputers that perform 5.78 quadrillion operations per second, while Canada's newest weather forecasting supercomputers have about half that power, running around 2.4 quadrillion operations per second.
Having that kind of power at our disposal has greatly expanded the number and types of models that we have access to now. Accompanying developments in personal computer technology have not only allowed us greater access to all of that information, but it has also fundamentally changed the way that forecasters actually produce the forecasts for the public.
Meteorologist Kerry-Ann Lecky Hepburn discusses how computers have impacted forecasting
One remarkable way that supercomputer advancements have changed forecasting is the introduction of 'ensemble forecasting'. This is where multiple runs of a weather model can be made, in succession or all at the same time, each with slight tweaks to both the model settings and the weather data fed into them.
Comparing the results generated by each ensemble 'member model' gives forecasters a better sense of the likelihood of any one outcome. A storm that shows up in all of the model members, despite many tweaks to the initial settings, is far more likely to actually happen that one that only develops in one or two of the members.
This methodology has also expanded forecasters' confidence in model guidance for long-range forecasts. If many ensemble members produce a significant storm 5 or 6 days in the future, that storm can be added into the long-range forecast with reasonable certainty, even though the eventual track or exact details may change with subsequent forecasts.
Dr Doug Gillham discusses how far our forecast confident has expanded over the years
COMMUNICATING THE WEATHER
Along with all of the above, advances in technology have also improved our ability to communicate forecasts to the public.
When The Weather Network first started up in 1989, we produced 5-day weather forecasts for 225 locations across Canada. It wasn't until the early 2000s that our forecasts extended to include the familiar 14-day trend. By that point, our coverage had expanded to produce forecasts for 5,000 points across the country; more than 20 times as many as when we started.
While that's an impressive feat for the first 15 years, the improvements in the 15 years since have matched the pace of improving technology.

This small sample from the Current Weather map on The Weather Network website shows dozens of stations that now receive weather forecasts. Even more locations pop up when zooming in, offering people personalized information for their community.
The Weather Network and our sister station, MeteoMedia, now generate forecasts for a combined total of 18 million locations, down to a resolution of 1 kilometre; a truly local forecast, with 10-minute precision for the timing of rain or snow. And the 5-day forecasts we produce now? They're as accurate as our next-day forecasts were in 1989.
Along with this, advancements in technology have made it far easier for the public to access their weather forecast. In 1989, the only real options were to stay glued to your television or keep your ear to the radio.
Lightning, thunder interrupt Nate Coleman's east coast forecast
Now, nearly anyone can see their weather, at any time, on multiple different platforms. Whether it's on their television at home, logging in to the web via their computer, or simply by looking at their smartphone, no matter where they are, Canadians can access up-to-the-minute weather data, forecasts, and reports from the field - information that could be vital for their safety, if severe weather is occurring.
Even with all of this, these advancements are still only the beginning.
With weather being the ultimate in shared interactive experiences, the internet is already allowing the public to share their weather with us, as it is happening. Further developments in computer and cellphone technology will only make it easier, and faster, to get this valuable feedback from those who are actually experiencing the weather, first hand.