Carbon dioxide tops 415 ppm, highest level in human history

The concentration of carbon dioxide in the atmosphere just reached a level not seen on Earth in nearly a million years.
What a way to start off this week!
On May 12, 2019, carbon dioxide levels in the atmosphere, as measured by instruments on top of Mauna Loa, Hawaii, reached 415 parts per million (ppm).
This is the first time in human history that we have seen these levels of carbon dioxide in Earth's atmosphere, but it is probably worse than that.
To find a time period where carbon dioxide levels were this high, we need to trace back all the way to the Pliocene Epoch, at least 2.2 million years ago! Research has shown that CO2 levels were around 400 ppm.
That is before the earliest humans (Homo habilis) began to walk the Earth!
Note: Parts per million is a physical measurement of how many molecules of a gas there are, compared to all the molecules in the atmosphere. Thus for every million molecules of air sampled on May 12, 2019, and each day since then (it is now May 15, 2019), 415 of them were carbon dioxide molecules.
WHAT IS THE KEELING CURVE?
The Keeling Curve, provided by the Scripps Institution of Oceanography, gives the daily reading of atmospheric carbon dioxide, in parts per million (ppm), measured at the top of Mauna Loa, Hawaii.
These measurements take into account local sources, such as the volcano itself, and subtract those off, thus leaving us with the average concentration of carbon dioxide in Earth's atmosphere.
The plots of the Keeling Curve, above, are presented for seeing where carbon dioxide (CO2) levels are now, compared to the past.
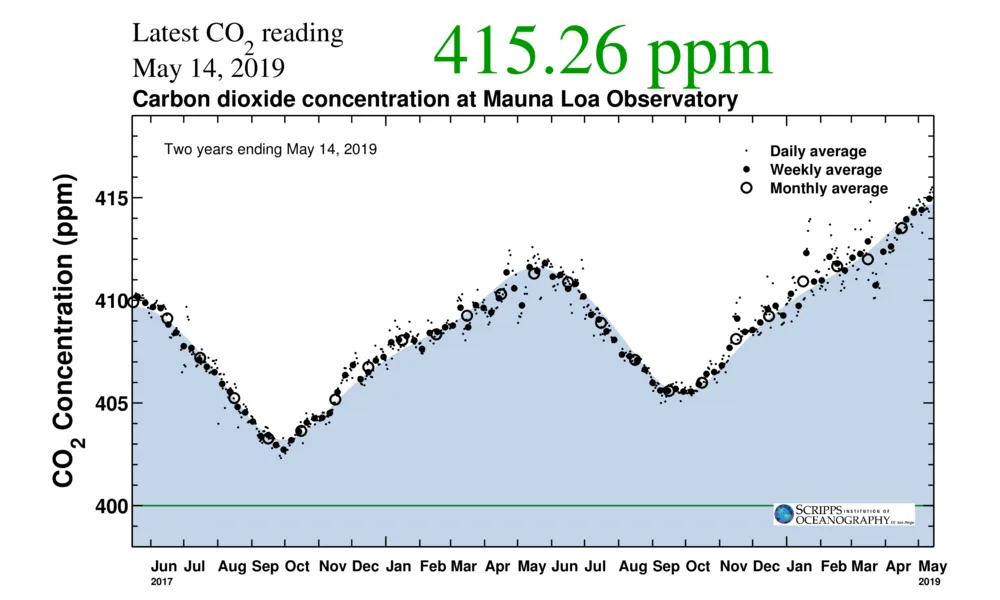
The past two years shows how much concentrations have risen on a daily (dot), weekly (bold dot) and monthly (circle) basis.
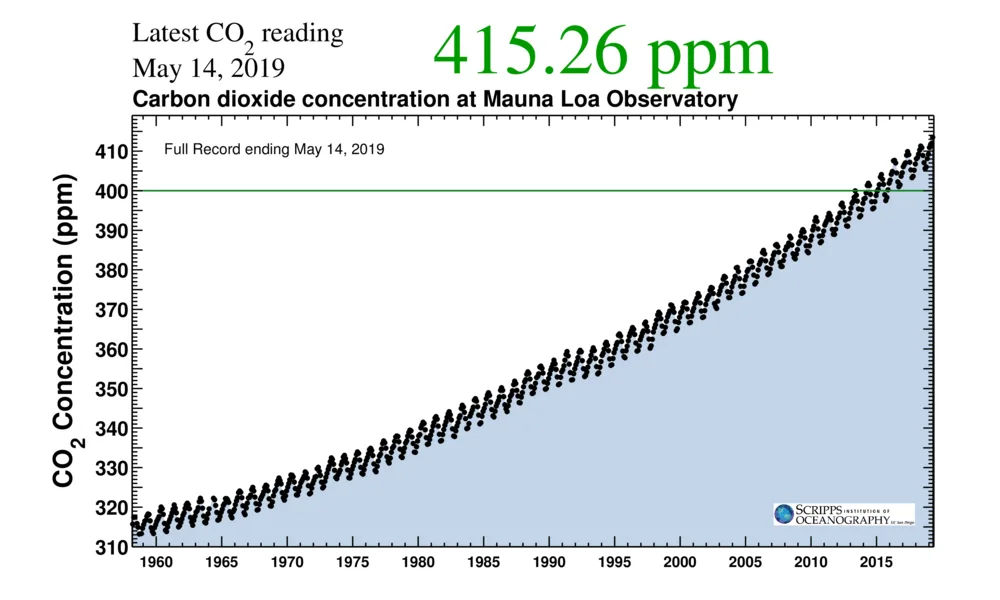
The full plot of the Keeling Curve, since the 1950s, shows just the monthly concentrations, how they rise and fall each year with the seasonal cycle, but how each year exceeds all years prior, as we continue to burn more fossil fuels.
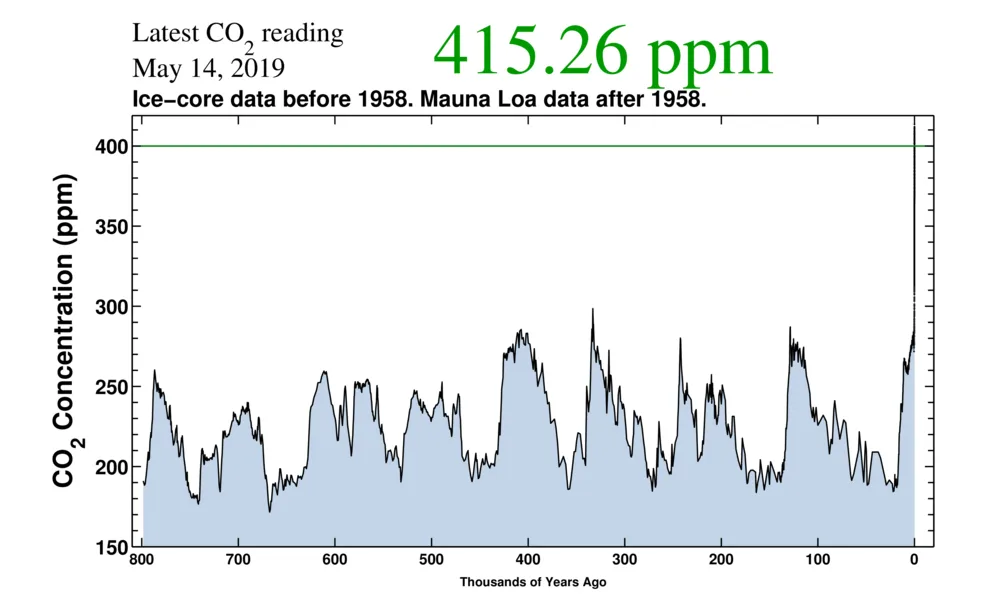
This last graph shows current levels (far right), compared to the past 800,000 years. Air extracted from ice cores reveals that carbon dioxide levels have fluctuated over the millennia, between around 170 parts per million to just shy of 300 ppm, and with a long-term average at around 220 ppm.
In 2013, the global carbon dioxide concentration peaked at over 400 parts per million, the first time we've ever seen levels that high. It took another four years for CO2 to exceed 410 ppm (in 2017) and now, just two years later, daily levels have reached 415 ppm. The yearly lowest concentration has kept pace and is also now above 400 ppm, and scientists estimate that it will be decades to centuries before we ever see the yearly minimum dip below 400 ppm again.
WHY IS THIS IMPORTANT?
Carbon dioxide is considered to be the 'global climate thermostat' for planet Earth.
What that means is, the abundance of this one gas in Earth's atmosphere is the primary controller of the planet's surface temperature, and thus its climate.
Carbon dioxide (CO2) is a greenhouse gas, one of the few gases in the atmosphere that are transparent to incoming solar radiation, but which absorb out-going infrared radiation the Earth is giving off as the surface cools. The other major greenhouse gases that also contribute to Earth's surface temperature are water vapour (H2O), methane (CH4), nitrous oxide (N2O), and ozone (O3). None of these others has the ability to regulate Earth's climate as effectively as CO2, though.
The simple reason behind this: Carbon dioxide is the most abundant temperature-independent greenhouse gas in Earth's atmosphere.
Ozone and nitrous oxide contribute a very small amount to the greenhouse effect on Earth. They just don't occur in enough abundance, near the surface, to have much of an impact.
Methane is a more potent greenhouse gas, molecule for molecule, than carbon dioxide. There is far less of it in the atmosphere, currently, though. So, carbon dioxide's contribution to the greenhouse effect far outweighs methane's, at this time.
Water vapour is also a more potent greenhouse gas than carbon dioxide. It is even more abundant in the atmosphere than CO2, as well, and thus currently contributes more to the overall greenhouse effect. Water vapour cannot be considered to be in control of Earth's climate, however, due to its strong dependence on temperature.
If you lower the temperature, sometimes even by just a few degrees, water vapour will condense into liquid water. This reduces its effectiveness at absorbing and reradiating infrared light. If you cool it further, it freezes solid, further reducing its contribution to the greenhouse effect.
Carbon dioxide, though, remains in gaseous form, and thus remains effective as a greenhouse gas, down to -78.5°C. Given that temperatures only get down that low in the extremes near the south pole, in the dead of southern winter, and do not remain that cold for long, CO2 is effectively a temperature independent gas on this planet.
So, the reason we have large quantities of water vapour in the atmosphere in the first place is due to this effective temperature independence of carbon dioxide. Thus, throughout the various ice ages and interglacial periods the Earth has gone through, it has largely been carbon dioxide that has regulated the planet's overall temperature.
In the past, when humans weren't around, carbon dioxide levels were controlled by things like explosions in the abundance of life, or mass die-offs, or immense volcanic eruptions.
In the roughly 10,000 years before the mid-1800s, when CO2 levels were fairly uniform at around 260-270 ppm, Earth's climate remained fairly stable. The greenhouse gases in the air absorbed just enough of the heat Earth radiated out towards space to keep the planet's average temperature fairly steady, at around 15°C.
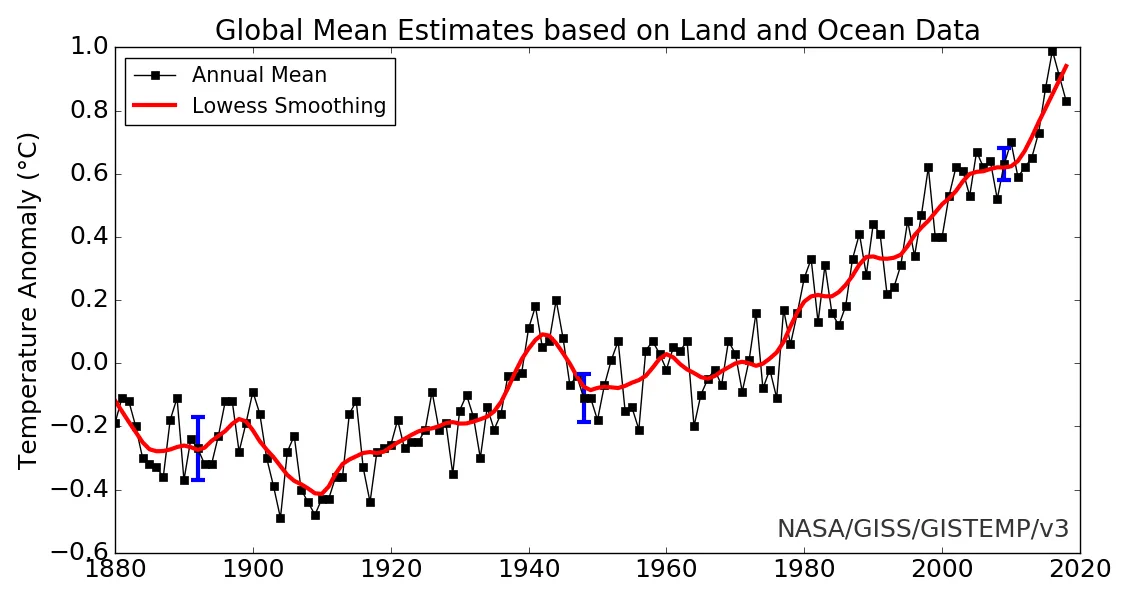
As shown in the graph below, which was compiled by NASA's Goddard Institute for Space Sciences, from 1880 to 2018, since humans began digging up and burning fossil fuels, the global average temperature has risen by roughly 1.2°C.
Seeing this kind of temperature increase in a small region, over a short period of time, such as in the local forecast for your city over a few days, is not much of a concern. It represents only a small amount of energy, and the temperature will eventually go down by that much, as well.
The entire planet warming up by over one degree, however, and in such a way that the temperature will not go down again by that amount for the foreseeable future, represents an immense amount of energy being invested into our weather and climate systems.
This is of great concern to us when it comes to extreme weather events and their potential impact on human civilization, and it is going to be even worse, going forward, as CO2 emissions continue to rise, and the temperature continues to rise along with them.
Sources: CNN | Scripps Institution for Oceanography | NASA | With files from The Weather Network