Carbon dioxide at Mauna Loa reaches new record high at 417 ppm

These could be the highest CO2 levels in our atmosphere in more than 3 million years
Another climate record was set in May of this year. Carbon dioxide levels in the atmosphere reached a new maximum, topping out at their highest concentration seen in all of recorded history and beyond.
As measured by the Scripps Institution of Oceanography, at the top of the Mauna Loa volcano in Hawai'i, atmospheric carbon dioxide reached a monthly average of 417.16 parts per million (ppm) for the month of May 2020. Just one year before, CO2 levels had reached a maximum of 415 ppm, and in 2018, the peak was 411 ppm.
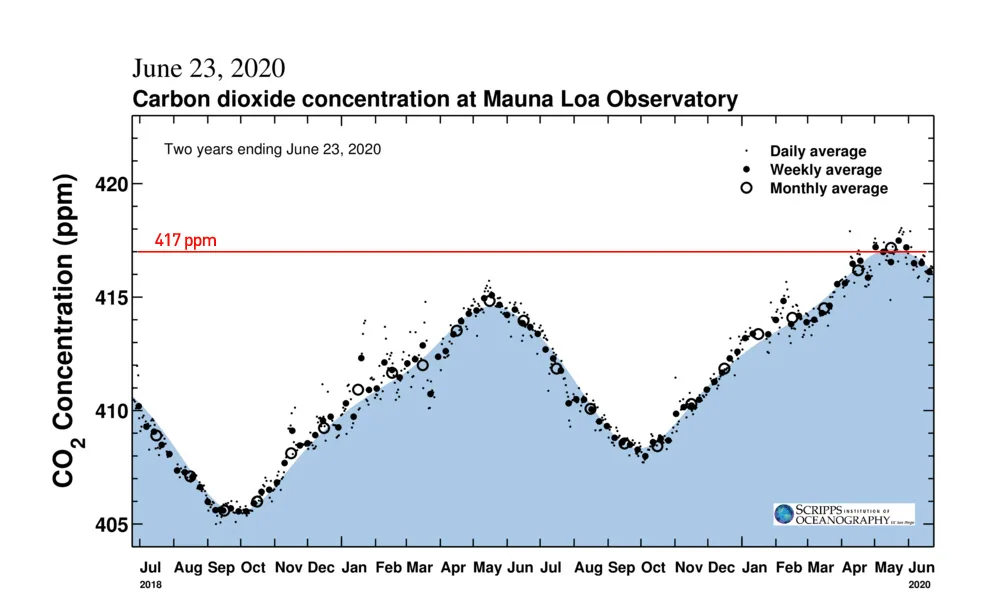
Two years worth of carbon dioxide levels, as measured from atop Mauna Loa in Hawai'i, are represented in the Keeling Curve. Shown are daily (dot), weekly (bold dot) and monthly (circle) average concentrations. The red line, added by the author, indicates the 417 parts-per-million threshold. Credit: Scripps Institution of Oceanography/Scott Sutherland
Compared to back at the beginning of the Keeling Curve, in 1958, carbon dioxide levels have risen by nearly 100 parts per million (they reached a maximum of 318 ppm in 1958). By examining gases trapped deep in glacial ice, tree rings, and even the carbon levels contained in fossils, scientists have determined that the last time carbon dioxide levels were this high in the atmosphere was over 3 million years ago, during the Pliocene Epoch. In that time of Earth's history, global temperatures were around 2-3°C warmer than today, the oceans were roughly 25 metres deeper, and there was no Arctic ice cap.
Note: Parts per million is a physical measurement of how many molecules of a gas there are, compared to all the molecules in the volume of air you sample. So, if the concentration measured at any one time is 417 ppm, for every million molecules of air in that sample, 417 of them were carbon dioxide molecules.
WHAT IS THE KEELING CURVE?
The Keeling Curve, provided by the Scripps Institution of Oceanography, gives the daily, weekly and monthly readings of atmospheric carbon dioxide, in parts per million (ppm), measured at the top of Mauna Loa, Hawaii.
These measurements are taken from this very remote region, high above the tree-line, to remove the influence of any direct sources. Any emissions from the volcano itself are also subtracted from the measurements, thus leaving us with the average concentration of carbon dioxide in Earth's atmosphere.
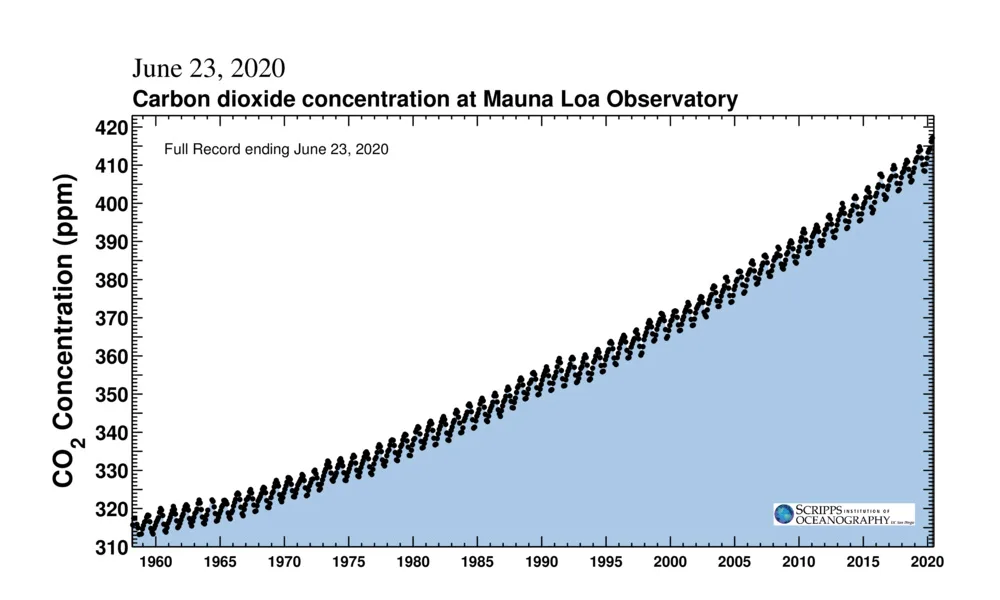
The full record of the Keeling Curve, since measurements began in 1958, plots the monthly concentrations. This shows not only the seasonal rise and fall of CO2 but also how each successive year's maximum continues to tick upward, as we burn more fossil fuels.
The 'saw-tooth' pattern of carbon dioxide levels, as shown in the above graph, is due to seasonal changes in plant life. It mostly follows along with northern hemisphere seasons because that half of the planet has more landmass, and thus is where most of Earth's land-based plant life is located. Concentrations reach their lowest levels near the end of September after plants have removed as much as they can during the spring and summer seasons. CO2 then increases as plants shut down for the winter, and it reaches its yearly peak in May, once the plants have had a chance to 'wake up' again in spring, and they consume enough CO2 for concentrations to begin to fall again.
Watch below: NASA climate scientist Bill Putman explains the yearly waxing and waning of carbon dioxide throughout a year
Looking back over the last 800,000 years, shown in the graph above, we can see just how unusual this spike in carbon dioxide is, compared to normal.
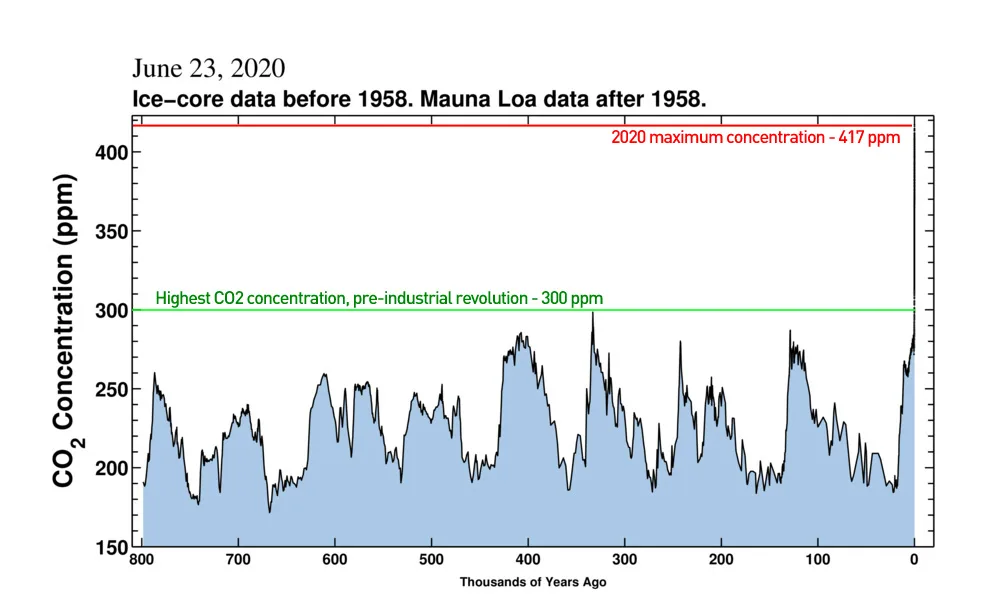
CO2 concentrations over the past 800,000 years reveal just how much human activity has impacted the world (far right), compared to pre-industrial times. Credit: Scripps Institution of Oceanography/Scott Sutherland
Agriculture began just 12,000 years ago, and human civilization is considered to be roughly 6,000 years old. In all of that time, carbon dioxide levels were between 260-280 ppm. In just 150 years, we've now added nearly 50 per cent more, on top of what was already naturally there. This is having profound effects on our climate and our environment.
WHY IS CARBON DIOXIDE SO IMPORTANT?
Carbon dioxide is a greenhouse gas, and it is considered to be the 'global climate thermostat' for planet Earth. That means the abundance of this one gas in Earth's atmosphere is the primary controller of the planet's surface temperature, and thus its climate.
Most of Earth's atmosphere - the 99.9 per cent made up of oxygen, nitrogen and argon - is 'transparent' to both solar radiation and the infrared radiation emitted by Earth. If these were the only gases in the atmosphere, Earth would be substantially colder, because all the heat the surface absorbed while it was facing the Sun would just radiate away into space as it rotated out of direct sunlight. None of that heat would stick around in the atmosphere to keep the planet warm, and we would likely have a 'snowball' Earth.
Carbon dioxide, on the other hand, is transparent to incoming sunlight, but it absorbs outgoing infrared radiation. With just a trace amount (around 0.04 per cent) in the atmosphere, enough of that heat is trapped that the planet stays warm enough for life to take hold and for human civilization to flourish. Adding more CO2 to the air, incidentally, causes more heat to be trapped than normal, which is why we are seeing a fairly steady rise in temperatures since the Industrial Revolution.
The other major greenhouse gases that also contribute to Earth's surface temperature are water vapour (H2O), methane (CH4), nitrous oxide (N2O), and ozone (O3). None of these can regulate Earth's climate as effectively as CO2, though, for a straightforward reason - carbon dioxide is the most abundant temperature-independent greenhouse gas in Earth's atmosphere.
Methane, ozone and nitrous oxide are more potent greenhouse gases than carbon dioxide. Methane is at least 25 times more potent, while ozone and nitrous oxide can be hundreds of times more potent. Fortunately for us, these gases just don't occur in enough abundance (yet) to have the same impact as carbon dioxide on the overall greenhouse effect.
Water vapour is also a more potent greenhouse gas than carbon dioxide, and it more abundant than CO2 as well. Thus, water vapour does contribute more to the overall greenhouse effect at any one time. It cannot be considered to be in control of Earth's climate, however, because it is strongly dependent on temperature.
If you lower the temperature, water vapour condenses into liquid water (clouds or rain), reducing its ability to absorb and reradiating infrared light. If you cool it further, it freezes solid, further reducing its contribution to the greenhouse effect.
Carbon dioxide, though, remains active as a greenhouse gas down to temperatures of -78.5°C. The only place on Earth where it gets that cold is near the south pole, in the dead of southern winter, and it does not remain that cold for very long. So, CO2 is effectively a temperature-independent gas everywhere on this planet.
The very reason we have large quantities of water vapour in Earth's atmosphere in the first place is due to the temperature independence of carbon dioxide. If the amount of CO2 in the air decreases, the planet cools, which causes water vapour to condense out and eventually freeze. This is how pretty much every glacial period in Earth's history started, as CO2 was absorbed from the air by various forms of life, and it became locked up or buried away in large quantities. It was only when carbon dioxide levels rose again, due to extreme volcanic events or mass die-offs, that temperatures increased, and the amount of water vapour in the atmosphere also increased.
In the roughly 10,000 years before the mid-1800s, when CO2 levels were reasonably uniform at around 260-270 ppm, Earth's climate remained relatively stable. The greenhouse gases in the air absorbed just enough of the heat Earth radiated out towards space to keep the planet's average temperature fairly steady, at around 15°C.
As shown in the graph below, from 1880 to 2019, the global average temperature has risen by roughly 1.2°C.
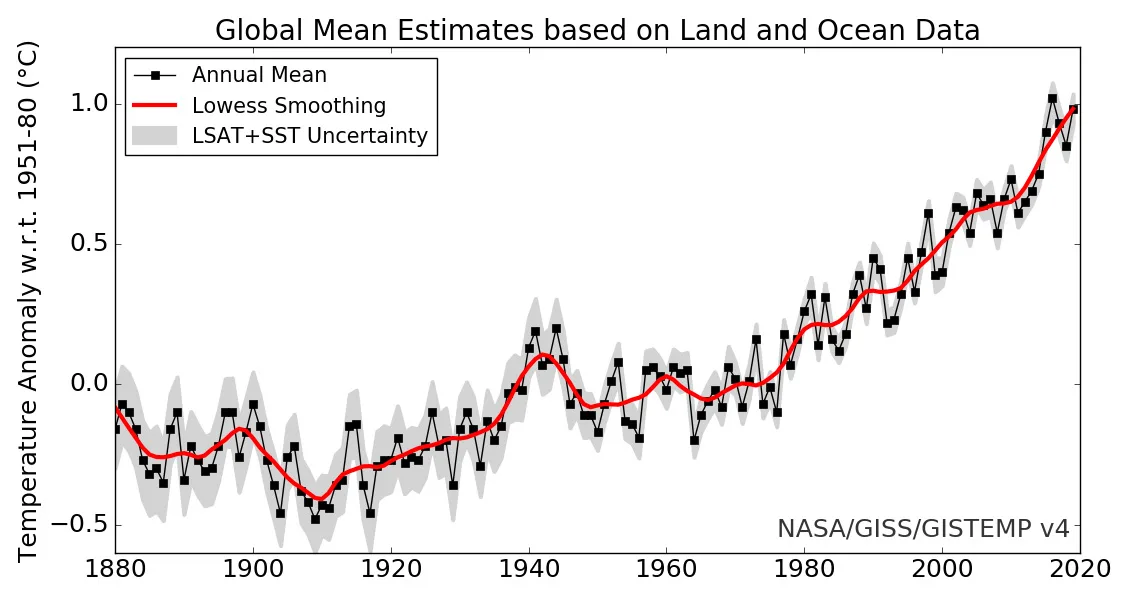
Credit: NASA's Goddard Institute for Space Sciences
Seeing this kind of temperature increase in a small region, over a short period of time, such as in the local forecast for your city over a few days, is not much of a concern. It represents only a small amount of energy, and the temperature will eventually go down by that much, as well.
The entire planet warming up by over one degree, however, and in such a way that the temperature will not go down again by that amount for the foreseeable future, represents an immense amount of energy being invested into our weather and climate systems.
This is of great concern to us when it comes to extreme weather events and their potential impact on human civilization. It is going to be even worse, going forward, as CO2 emissions continue to rise, and the temperature continues to rise along with them.
Sources: Scripps Institution for Oceanography | NASA | EPA | With files from The Weather Network
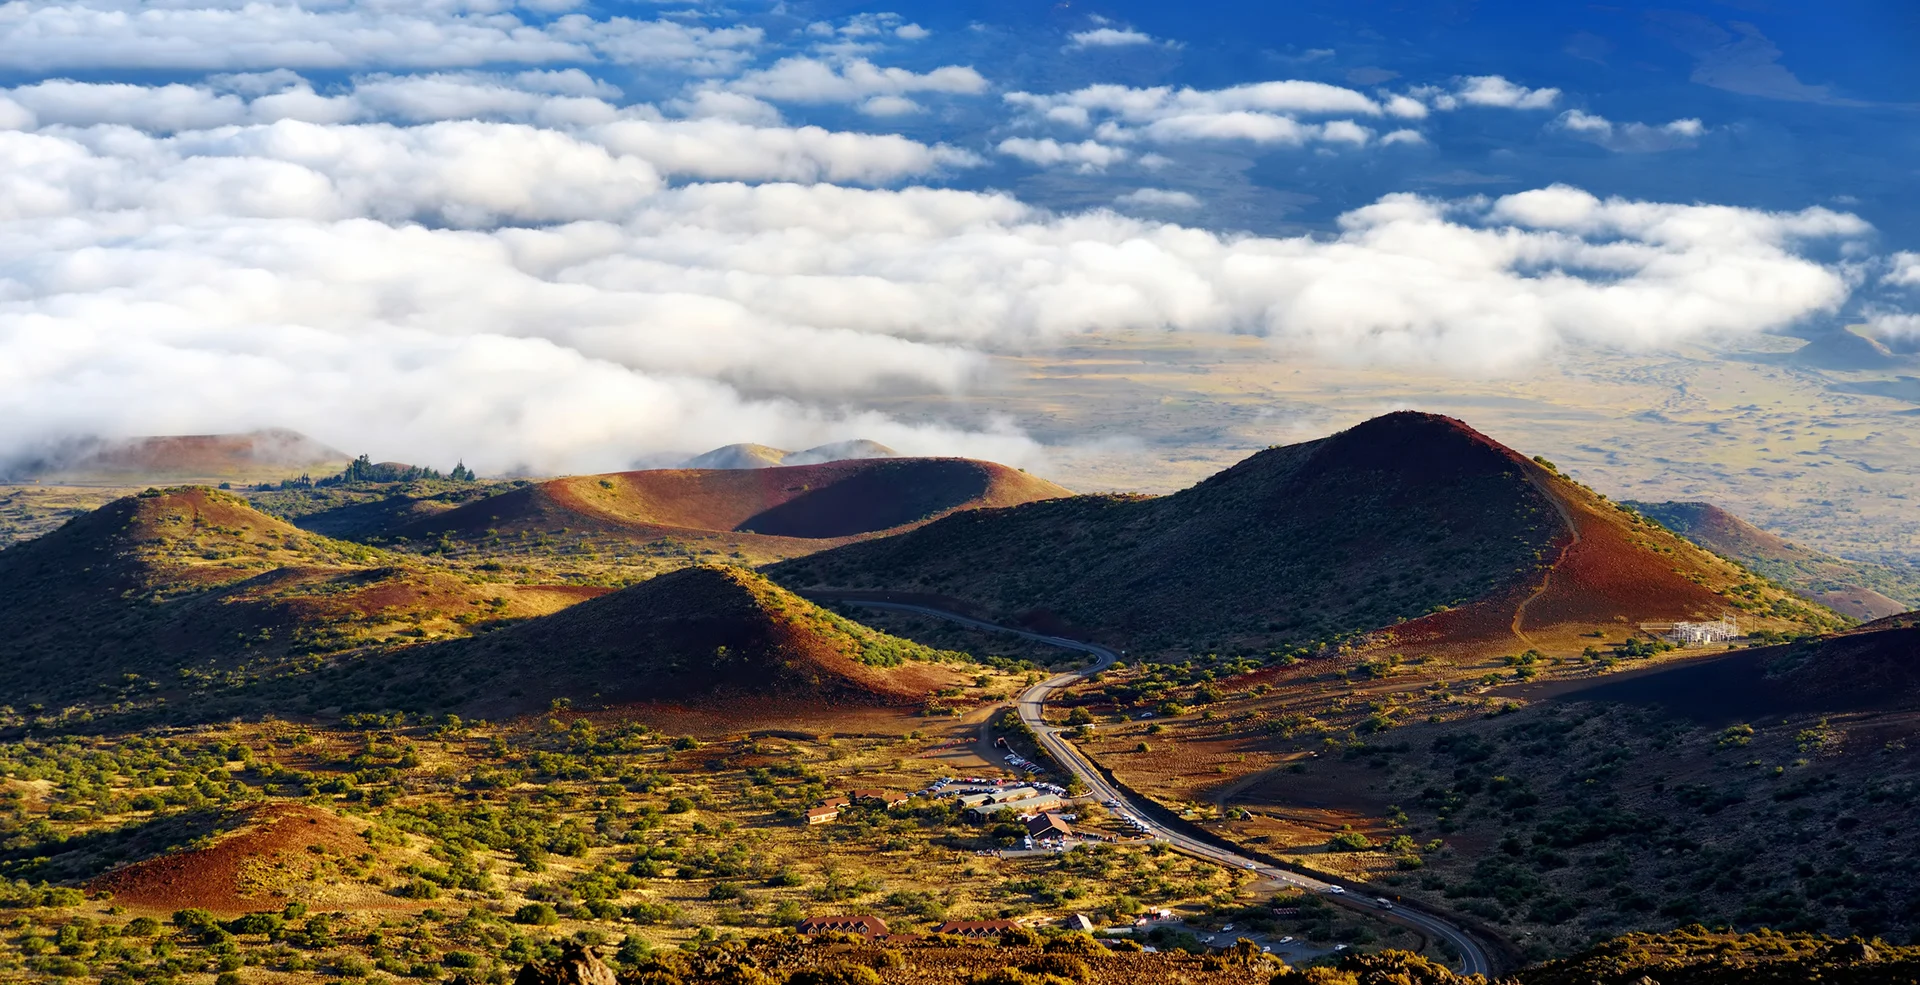
Top Photo Credit: Getty Images